Page 105 - Application Handbook - Liquid Chromatography
P. 105

Application  No.L457
    News

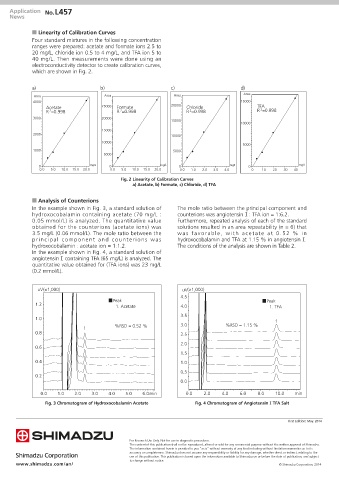
            n Linearity of Calibration Curves
            Four standard mixtures in the following concentration
            ranges were prepared: acetate and formate ions 2.5 to
            20 mg/L, chloride ion 0.5 to 4 mg/L, and TFA ion 5 to
            40 mg/L. Then measurements were done using an
            electroconductivity detector to create calibration curves,
            which are shown in Fig. 2.


            a)                      b)                       c)                       d)
             Area                     Area                    Area                     Area
             4000                                                                     15000
                 Acetate             25000  Formate          20000  Chloride               TFA
                                                                                             2
                                           2
                  2
                 R =0.998                 R =0.998                R =0.998                 R =0.998
                                                                    2
             3000                    20000
                                                             15000
                                                                                      10000
                                     15000
             2000                                            10000
                                     10000
                                                                                      5000
             1000                                             5000
                                     5000
               0                 mg/L  0                 mg/L   0                 mg/L  0                 mg/L
               0.0  5.0  10.0  15.0  20.0  0.0  5.0  10.0  15.0  20.0  0.0  1.0  2.0  3.0  4.0  0  10  20  30  40
                                           Fig. 2  Linearity of Calibration Curves
                                                a) Acetate, b) Formate, c) Chloride, d) TFA
            n Analysis of Counterions
            In the example shown in Fig. 3, a standard solution of   The mole ratio between the principal component and
            hydroxocobalamin containing acetate (70 mg/L :     counterions was angiotensin Ⅰ : TFA ion = 1:6.2.
            0.05 mmol/L) is analyzed. The quantitative value   Furthermore, repeated analysis of each of the standard
            obtained for the counterions (acetate ions) was    solutions resulted in an area repeatability (n = 6) that
            3.5 mg/L (0.06 mmol/L). The mole ratio between the   was favorable, with acetate at 0.52   % i n
            principal component and counterions was            hydroxocobalamin and TFA at 1.15 % in angiotensin Ⅰ.
            hydroxocobalamin : acetate ion = 1:1.2.            The conditions of the analysis are shown in Table 2.
            In the example shown in Fig. 4, a standard solution of
            angiotensin Ⅰ containing TFA (65 mg/L) is analyzed. The
            quantitative value obtained for (TFA ions) was 23 mg/L
            (0.2 mmol/L).


              uV(×1,000)                                         uV(×1,000)
                                                                4.5
                                       ˙Peak                                                 ˙Peak
             1.2
                                          1. Acetate            4.0                             1. TFA
                                                                3.5
             1.0                                                                                  1
                                         %RSD = 0.52 %          3.0             %RSD = 1.15 %
                              1
             0.8                                                2.5
                                                                2.0
             0.6
                                                                1.5
             0.4                                                1.0
                                                                0.5
             0.2
                                                                0.0

               0.0   1.0   2.0   3.0   4.0   5.0   6.0min         0.0    2.0   4.0   6.0    8.0   10.0   min
                 Fig. 3 Chromatogram of Hydroxocobalamin Acetate      Fig. 4 Chromatogram of Angiotensin Ⅰ TFA Salt


                                                                                                      First Edition: May. 2014


                                               For Research Use Only. Not for use in diagnostic procedures.
                                               The content of this publication shall not be reproduced, altered or sold for any commercial purpose without the written approval of Shimadzu.
                                               The information contained herein is provided to you "as is" without warranty of any kind including without limitation warranties as to its
                                               accuracy or completeness. Shimadzu does not assume any responsibility or liability for any damage, whether direct or indirect, relating to the
                                               use of this publication. This publication is based upon the information available to Shimadzu on or before the date of publication, and subject
                                               to change without notice.
       www.shimadzu.com/an/                                                                        © Shimadzu Corporation, 2014
   100   101   102   103   104   105   106   107   108