Page 10 - 2_Pharmaceutical industry
P. 10

SCA-130-204


            ■ TOC-Control L software                            The determination of benzoquinone is set in
            The TOC-Control L software simplifies the           the sample / method properties wizard.
            implementation of the system suitability tests
            using integrated templates for the creation of
            calibration  curves  and  the  measurement  of
            the control sample.


                       Fig.  Calibration curve wizard

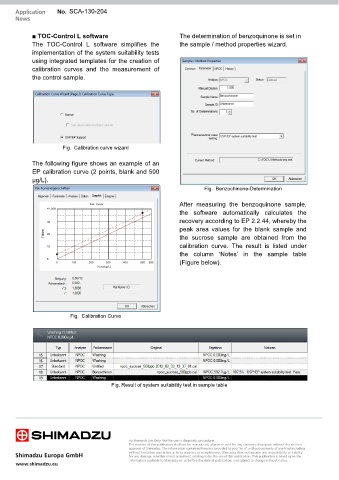
            The following figure shows an example of an
            EP calibration curve (2 points, blank and 500
            µg/L).

                                                                         Fig.  Benzochinone-Determination

                                                                After measuring the benzoquinone sample,
                                                                the software automatically calculates the
                                                                recovery according to EP 2.2.44, whereby the
                                                                peak  area  values  for  the  blank  sample  and
                                                                the sucrose sample are obtained from the
                                                                calibration  curve. The result is listed under
                                                                the  column  ‘Notes’  in  the  sample  table
                                                                (Figure below).


                          Fig.  Calibration Curve


                                        Fig. Result of system suitability test in sample table
   5   6   7   8   9   10   11   12   13   14   15