
Page 17 - Shimadzu Journal vol.9 Issue1
P. 17
Clinical Research
labeled H2O in Figure 2, the Ag nano-
rods do not exhibit any of the secondary
peaks and there is a significant decrease
in the intensity of and blue shift of the
main resonance peak. Surface plasmon
resonance is considered to be the domi-
nating factor in most sensing applications
using Ag nanorods, and the decrease in
resonance peak is expected to result in a
17
decrease in sensing activity .
Next, we present the results of a time
resolved in-situ experiment measuring the
optical reflectance of Ag nanorods depos-
ited inside a cuvette exposed to non-de- Figure 2. UV-Vis reflection spectra for Ag nanorod samples exposed to varied conditions for 12 hours.
gassed water, Figure 3. Scans are taken
every 10 minutes over the course of one
hour, progressing in the direction of the
arrow on Figure 3. It is noted that even
within only one hour there is an observable
change in reflective spectrum. This is signifi-
cant as the area of decrease overlaps with the
commonly used Raman laser lines of 473
nm and 524 nm, which may lead to changes
in measured Raman signals.
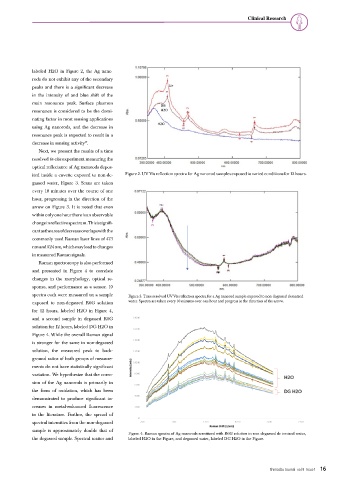
Raman spectroscopy is also per formed
and presented in Figure 4 to correlate
changes in the morphology, optical re-
sponse, and performance as a sensor. 10
spectra each were measured on a sample Figure 3. Time resolved UV-Vis reflection spectra for a Ag nanorod sample exposed to non-degassed deionized
exposed to non-degassed R6G solution water. Spectra are taken every 10 minutes over one hour and progress in the direction of the arrow.
for 12 hours, labeled H2O in Figure 4,
and a second sample in degassed R6G
solution for 12 hours, labeled DG H2O in
Figure 4. While the overall Raman signal
is stronger for the same in non-degassed
solution, the measured peak to back-
ground ratios of both groups of measure-
ments do not have statistically significant
variation. We hypothesize that the corro-
sion of the Ag nanorods is primarily in
the form of oxidation, which has been
demonstrated to produce significant in-
creases in metal-enhanced fluorescence
in the literature. Further, the spread of
spectral intensities from the non-degassed
sample is approximately double that of
Figure 4. Raman spectra of Ag nanorods sensitized with R6G solution in non-degassed de-ionized water,
the degassed sample. Spectral scatter and labeled H2O in the Figure, and degassed water, labeled DG H2O in the Figure.
Shimadzu Journal vol.9 Issue1 16