
Page 16 - Shimadzu Journal vol.9 Issue1
P. 16
Clinical Research
256 x 256. In the first test, the samples were taken directly out of times with degassed deionized water and dried under a gentle flow
vacuum and immediately imaged. In the second test, the samples of dry nitrogen. The instrument used is a Horiba T64000 Raman
were exposed to non-degassed water for two hours, dried under Spectrometer equipped with the microscope utility and liquid ni-
a gentle flow of dry nitrogen, and then imaged. Contact mode trogen cooled CCD detector. A 10 X Olympus objective was used
was first used to generate topographical maps of the sample sur- to focus the 532 nm laser to a ~10 µm spot on the surface of the
faces. Next, the SPM was run the Kelvin Probe Force Microscopy sample. The laser power does not exceed 10 µW. The entrance slit
(KFM) mode to analyze the surface potentials and give evidence of of the spectrometer is set at 200 µm. The accumulation time is set at
surface chemical changes. KFM is a noncontact variation of the 1 second with 25 accumulations per spectrum. The spectral range
SPM where the probe is held at a constant height above the extends from 250 to 2250 wavenumbers and 10 scans are taken for
sample and a voltage bias is applied to the probe and the surface is each measurement.
locally mapped.
Results
UV-Vis
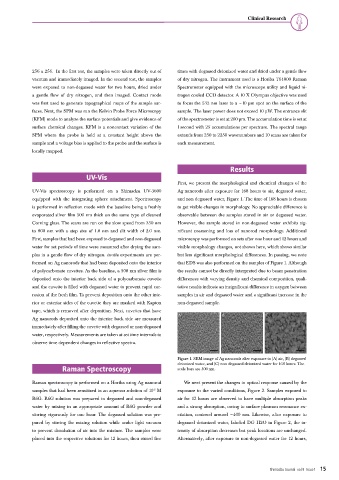
First, we present the morphological and chemical changes of the
UV-Vis spectroscopy is performed on a Shimadzu UV-3600 Ag nanorods after exposure for 168 hours to air, degassed water,
equipped with the integrating sphere attachment. Spectroscopy and non-degassed water, Figure 1. The time of 168 hours is chosen
is performed in reflection mode with the baseline being a freshly to get visible changes in morphology. No appreciable difference is
evaporated silver film 500 nm thick on the same type of cleaned observable between the samples stored in air or degassed water.
Corning glass. The scans are run on the slow speed from 350 nm However, the sample stored in non-degassed water exhibits sig-
to 800 nm with a step size of 1.0 nm and slit width of 2.0 nm. nificant coarsening and loss of nanorod morphology. Additional
First, samples that had been exposed to degassed and non-degassed microscopy was performed on sets after one hour and 12 hours and
water for set periods of time were measured after drying the sam- visible morphology changes, not shown here, which shows similar
ples in a gentle flow of dry nitrogen. in-situ experiments are per- but less significant morphological differences. In passing, we note
formed on Ag nanorods that had been deposited onto the interior that EDS was also performed on the samples of Figure 1. Although
of polycarbonate cuvettes. As the baseline, a 500 nm silver film is the results cannot be directly interpreted due to beam penetration
deposited onto the interior back side of a polycarbonate cuvette differences with varying density and chemical composition, quali-
and the cuvette is filled with degassed water to prevent rapid cor- tative results indicate an insignificant difference in oxygen between
rosion of the fresh film. To prevent deposition onto the other inte- samples in air and degassed water and a significant increase in the
rior or exterior sides of the cuvette they are masked with Kapton non-degassed sample.
tape, which is removed after deposition. Next, cuvettes that have
A B C
Ag nanorods deposited onto the interior back side are measured
immediately after filling the cuvette with degassed or non-degassed
water, respectively. Measurements are taken at set time intervals to
observe time dependent changes in reflective spectra.
Figure 1. SEM image of Ag nanorods after exposure to (A) air, (B) degassed
deionized water, and (C) non-degassed deionized water for 168 hours. The
Raman Spectroscopy scale bars are 500 nm.
Raman spectroscopy is performed on a Horiba using Ag nanorod We next present the changes in optical response caused by the
samples that had been sensitized in an aqueous solution of 10 M exposure to the varied conditions, Figure 2. Samples exposed to
-5
R6G. R6G solution was prepared in degassed and non-degassed air for 12 hours are observed to have multiple absorption peaks
water by mixing in an appropriate amount of R6G powder and and a strong absorption, owing to surface plasmon resonance ex-
stirring vigorously for one hour. The degassed solution was pre- citation, centered around ~400 nm. Likewise, after exposure to
pared by stirring the mixing solution while under light vacuum degassed deionized water, labeled DG H2O in Figure 2, the in-
to prevent dissolution of air into the mixture. The samples were tensity of absorption decreases but peak locations are unchanged.
placed into the respective solutions for 12 hours, then rinsed five Alternatively, after exposure to non-degassed water for 12 hours,
Shimadzu Journal vol.9 Issue1 15