
Page 9 - Shimadzu Journal vol.7 Issue2
P. 9
Food Development
protonated amino group of amino acids arising in the pores of stationary In constructing this analytical technology, we first fine-tuned MS/MS
phase packing particles is also thought to play a role in separation. parameters to develop a method of analyzing trace amounts of
These interactions with the chiral selector and stationary phase are D-amino acids with high sensitivity. The we then compared the
presumed to enable the separation of underivatized D- and L-amino performance of this method with an existing method and evaluated
acids where the selectivity of this separation is anticipated to arise the results. The findings of this investigation are presented below.
through a mixed mode of reverse phase distribution, hydrophilic
interaction, and electrostatic exclusion (Konya et al. 2018). 1-3. Development of a High-Sensitivity Analytical Method for
Quantitative Analysis of Trace Amounts of D-Amino Acids
&⒎FDU PG UIF $IJSBM 4FMFDUPS &⒎FDU PG UIF 4UBUJPOBSZ 1IBTF
In using LC-MS/MS to develop a high-sensitivity quantitative analytical
method for trace amounts of D-amino acids, we separated development
into a stepwise investigation of the following three items: 1. analytical
method development, 2. evaluation of the newly developed analytical
method, and 3. method application in sample analysis. An overview of
each of these three items is given below.
1. Analytical Method Development
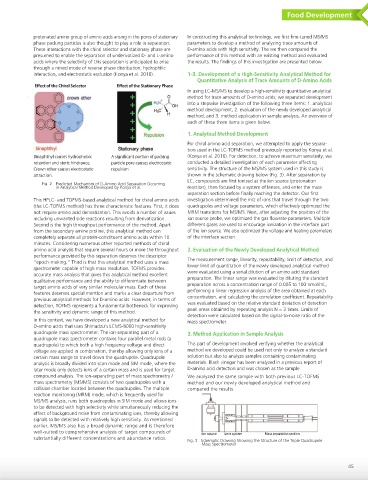
For chiral amino acid separation, we attempted to apply the separa-
tion used in the LC-TOFMS method previously reported by Konya et al.
#JOBQIUIZM DBVTFT IZESPQIPCJD " TJHOJpDBOU QPSUJPO PG QBDLJOH (Konya et al. 2016). For detection, to achieve maximum sensitivity, we
SFUFOUJPO BOE TUFSJD IJOESBODF QBSUJDMF QPSF DBVTFT FMFDUSPTUBUJD conducted a detailed investigation of each parameter affecting
$SPXO FUIFS DBVTFT FMFDUSPTUBUJD SFQVMTJPO sensitivity. The structure of the MS/MS system used in this study is
BUUSBDUJPO shown in the schematic drawing below (Fig. 3). After separation by
LC, compounds are first ionized at the ion source (protonation
Fig. 2 Predicted Mechanism of D-Amino Acid Separation Occurring
in Analytical Method Developed by Konya et al. reaction), then focused by a system of lenses, and enter the mass
separation section before finally reaching the detector. Our first
This HPLC- and TOFMS-based analytical method for chiral amino acids investigation determined the m/z of ions that travel through the two
(the LC-TOFMS method) has three characteristic features. First, it does quadrupoles and voltage parameters, which effectively optimized the
not require amino acid derivatization. This avoids a number of issues MRM transitions for MS/MS. Next, after adjusting the position of the
including unwanted side reactions resulting from derivatization. ion source probe, we optimized the gas flowrate parameters. Multiple
Second is the high throughput performance of the method. Apart different gases are used to encourage ionization in the interface part
from the secondary amine proline, this analytical method can of the ion source. We also optimized the voltage and heating parameters
completely separate all protein-constituent amino acids within 10 of the interface section.
minutes. Considering numerous other reported methods of chiral
amino acid analysis that require several hours or more the throughput 2. Evaluation of the Newly Developed Analytical Method
performance provided by this separation deserves the descriptor
“epoch-making.” Third is that this analytical method uses a mass The measurement range, linearity, repeatability, limit of detection, and
spectrometer capable of high mass resolution. TOFMS provides lower limit of quantitation of the newly developed analytical method
accurate mass analysis that gives this analytical method excellent were evaluated using a serial dilution of an amino acid standard
qualitative performance and the ability to differentiate between preparation. The linear range was evaluated by diluting the standard
target amino acids of very similar molecular mass. Each of these preparation across a concentration range of 0.005 to 100 nmol/mL,
features deserves special mention and marks a clear departure from performing a linear regression analysis of the area obtained at each
concentration, and calculating the correlation coefficient. Repeatability
previous analytical methods for D-amino acids. However, in terms of
detection, TOFMS represents a fundamental bottleneck for improving was evaluated based on the relative standard deviation of detection
the sensitivity and dynamic range of this method. peak areas obtained by repeating analysis N = 3 times. Limits of
detection were calculated based on the signal-to-noise ratio of the
In this context, we have developed a new analytical method for mass spectrometer.
D-amino acids that uses Shimadzu’s LCMS-8060 high-sensitivity
quadrupole mass spectrometer. The ion-separating part of a 3. Method Application in Sample Analysis
quadrupole mass spectrometer contains four parallel metal rods (a
quadrupole) to which both a high frequency voltage and direct This part of development involved verifying whether the analytical
voltage are applied in combination, thereby allowing only ions of a method we developed could be used not only to analyze a standard
certain mass range to travel down the quadrupole. Quadrupole solution but also to analyze samples containing contaminating
analysis is broadly divided into scan mode and SIM mode, where the materials. Black vinegar has been analyzed in a previous report of
later mode only detects ions of a certain mass and is used for target D-amino acid detection and was chosen as the sample.
compound analysis. The ion-separating part of mass spectrometry / We analyzed the same sample with both previous LC-TOFMS
mass spectrometry (MS/MS) consists of two quadrupoles with a method and our newly developed analytical method and
collision chamber located between the quadrupoles. The multiple compared the results.
reaction monitoring (MRM) mode, which is frequently used for
MS/MS analysis, runs both quadrupoles in SIM mode and allows ions
to be detected with high selectivity while simultaneously reducing the
effect of background noise from contaminating ions, thereby allowing
signals to be detected with relatively high sensitivity. As mentioned
earlier, MS/MS also has a broad dynamic range and is therefore
well-suited to comprehensive analysis of target compounds of *PO TPVSDF -FOT TZTUFN .BTT TFQBSBUJPO TFDUJPO
substantially different concentrations and abundance ratios.
Fig. 3 Schematic Drawing Showing the Structure of the Triple Quadrupole
Mass Spectrometer
45