
Page 12 - Shimadzu Journal vol.7 Issue2
P. 12
Food Development
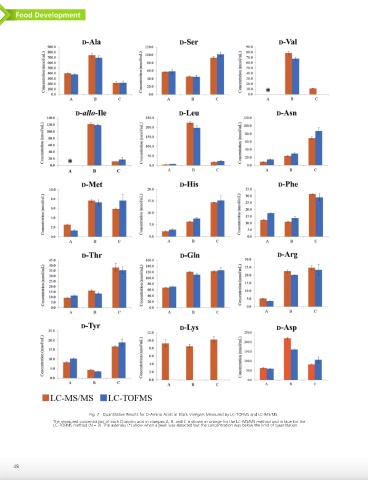
Fig. 7 Quantitative Results for D-Amino Acids in Black Vinegars Measured by LC-TOFMS and LC-MS/MS
The measured concentration of each D-amino acid in vinegars A, B, and C is shown in orange for the LC-MS/MS method and in blue for the
LC-TOFMS method (N = 3). The asterisks (*) show when a peak was detected but the concentration was below the limit of quantitation.
48