
Page 11 - Shimadzu Journal vol.7 Issue2
P. 11
Food Development
1-3-2. Evaluation of the Newly Developed Analytical Method 1-3-3. Method Application in Sample Analysis
The performance of the newly developed method of chiral amino acid To evaluate the usefulness of the LC-MS/MS method for chiral
analysis using the optimized LC-MS/MS (the LC-MS/MS method) was amino acid analysis, the method was used for quantitative
evaluated by examining measurement range, linearity, repeatability, analysis of D-amino acids in food. Three different types of
limit of detection, and lower limit of quantitation (Table 1). This commercially available black vinegar were used as samples.
evaluation involved using the newly developed method to analyze a Reports have revealed that vinegar contains several different
serial dilution of an amino acid standard solution (0.005, 0.01, 0.05, D-amino acids (Tani et al. 2009; Miyoshi et al. 2014), and a
0.5, 1, 5, 50, and 100 nmol/mL), dividing the area data for each number of different bacteria including lactic acid bacteria are
amino acid by the peak area of an internal standard, and correcting reported to play a major role in D-amino acid formation in
for injection errors, etc. that can arise during analysis. In this study, vinegar (Mutaguchi et al. 2013). First, the three different black
each validated item was evaluated based on a variety of criteria vinegars underwent pretreatment. The pretreatment method
including validation guidelines for analytical method development reported by Konya et al. (2017), which has been thoroughly
established by the International Council for Harmonisation of Technical examined for recovery rates and effect on LC-MS analysis, was
Requirements for Pharmaceuticals for Human Use (ICH). The measurement used for this D-amino acid analysis. Quantitative analysis of
range was determined by considering the accuracy and trueness of D-amino acids was performed using a calibration curve created
analytical values at either extremity and taking the maximum linear from peak areas obtained by analyzing a serial dilution of an
range for D-methionine, D-aspartic acid, D-glutamine, and D-glutamic amino acid standard solution. The serial dilutions used in
acid (0.005–100 nmol/mL). This produced a high correlation coefficient quantitative analysis underwent the same pretreatment as
of 0.99 or above for the respective measurement ranges of each target vinegar samples and were corrected for extraction errors. All
amino acid and demonstrated the LC-MS/MS method is capable of vials intended for analysis also contained a fixed concentration
quantitative analysis of D-amino acids across a wide dynamic range. of DL-alanine-2,3,3,3-d4 internal standard, and each data
Repeatability was evaluated based on the relative standard deviation point was corrected based on the measured result for
(RSD) of the area of each peak obtained after analyzing an amino acid D-alanine-2,3,3,3-d4 to account for injection and ionization
standard solution three times in succession. A mean RSD of 8.1% was errors. Target D-amino acids were analyzed simultaneously
obtained for all target amino acids at 0.05 nmol/mL other from using CROWNPAK CR-I (+), and CROWNPAK CR-I (-) was used
D-alanine, and for D-alanine at 0.5 nmol/mL the RSD was 15.9%. An to detect D-lysine and to identify the peaks of D-isoleucine and
RSD of not more than 20% for any peak area showed the LC-MS/MS D-allo-isoleucine.
method achieves good repeatability. Limits of detection were taken as The LC-MS/MS method detected and quantified 14 D-amino acids in
the target compound concentration where the detected peak (signal the vinegar samples (D-alanine, D-serine, D-valine, D-threonine,
intensity) was three (or more) times the noise, and limits of quantitation D-allo-isoleucine, D-leucine, D-asparagine, D-glutamic acid, D-methionine,
were taken as the target compound concentration where the detected D-histidine, D-phenylalanine, D-arginine, D-tyrosine, and D-lysine).
peak (signal intensity) was 10 (or more) times the noise. Noise was Similar D-amino acids were detected in all three vinegars, though
calculated from the standard deviation of signals at measurement D-amino acid concentrations differed in each vinegar. Next, the same
points in sections before and after target compound detection. Limits samples were analyzed again within 24 hours by the LC-TOFMS
of detection differed by amino acid in the concentration range method. To allow a comparison of results, the separation conditions
0.005–0.5 nmol/mL and D-amino acids were detectable on the order used in LC and other analytical conditions were consistent across both
of several pmol, showing that this method gives favorable results the LC-TOFMS method and the LC-MS/MS method. The LC-TOFMS
when used for the analysis of trace amounts of target compounds in method detected and quantified 13 D-amino acids (D-alanine, D-serine,
samples. D-valine, D-threonine, D-allo-isoleucine, D-leucine, D-asparagine,
D-glutamic acid, D-methionine, D-histidine, D-phenylalanine, D-arginine,
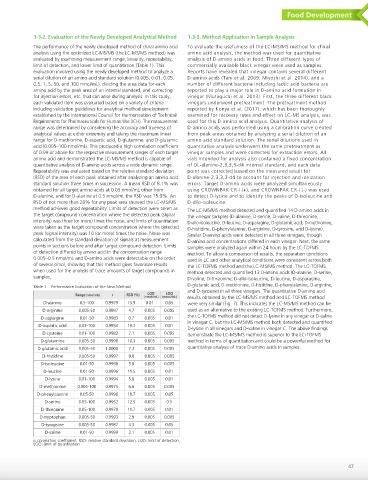
Table 1 Performance Evaluation of the New Method
and D-tyrosine) in all three vinegars. The quantitative D-amino acid
3BOHF ONPM N- S 34% -0% -02
ONPM N- ONPM N- results obtained by the LC-MS/MS method and LC-TOFMS method
% BMBOJOF were very similar (Fig. 7). This indicates the LC-MS/MS method can be
% BSHJOJOF used as an alternative to the existing LC-TOFMS method. Furthermore,
the LC-TOFMS method did not detect D-lysine in any vinegar or D-valine
% BTQBSHJOF
in vinegar C, but the LC-MS/MS method both detected and quantified
% BTQBSUJD BDJE
D-lysine in all vinegars and D-valine in vinegar C. The above findings
% DZTUFJOF demonstrate the LC-MS/MS method is superior to the LC-TOFMS
% HMVUBNJOF method in terms of quantitation and could be a powerful method for
quantitative analysis of trace D-amino acids in samples.
% HMVUBNJD BDJE
% IJTUJEJOF
% JTPMFVDJOF
% MFVDJOF
% MZTJOF
% NFUIJPOJOF
% QIFOZMBMBOJOF
% TFSJOF
% UISFPOJOF
% USZQUPQIBO
% UZSPQTJOF
% WBMJOF
r: correlation coefficient, RSD: relative standard deviation, LOD: limit of detection,
LOQ: limit of quantitation
47