
Page 17 - Shimadzu RF-6000
P. 17
3D Measurements
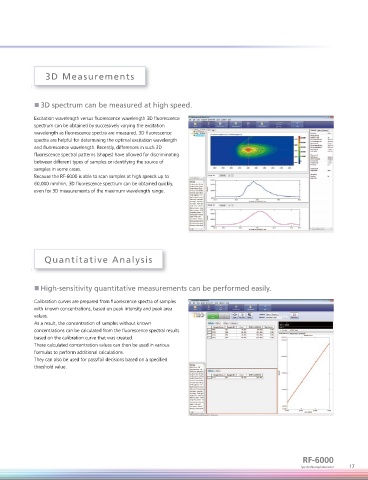
■ 3D spectrum can be measured at high speed.
Excitation wavelength versus fluorescence wavelength 3D fluorescence
spectrum can be obtained by successively varying the excitation
wavelength as fluorescence spectra are measured. 3D fluorescence
spectra are helpful for determining the optimal excitation wavelength
and fluorescence wavelength. Recently, differences in such 3D
fluorescence spectral patterns (shapes) have allowed for discriminating
between different types of samples or identifying the source of
samples in some cases.
Because the RF-6000 is able to scan samples at high speeds up to
60,000 nm/min, 3D fluorescence spectrum can be obtained quickly,
even for 3D measurements of the maximum wavelength range.
Quantitative Analysis
■ High-sensitivity quantitative measurements can be performed easily.
Calibration curves are prepared from fluorescence spectra of samples
with known concentrations, based on peak intensity and peak area
values.
As a result, the concentration of samples without known
concentrations can be calculated from the fluorescence spectral results
based on the calibration curve that was created.
These calculated concentration values can then be used in various
formulas to perform additional calculations.
They can also be used for pass/fail decisions based on a specified
threshold value.
RF-6000
Spectrofluorophotometer 17