
Page 16 - Shimadzu RF-6000
P. 16
Spectrum Correction
■ Spectrum correction functions are included standard,
which allows you to display spectrum corrected automatically!
A spectrum correction function for obtaining the true excitation and fluorescence spectrum
determined by correcting the instrument function for instrument characteristics, such as the
emission characteristics of the light source and spectrum characteristics of the optical system, is
included standard. Because true spectrum can be obtained automatically, the spectra can be
easily compared to spectrum measured using other instruments.
The spectrum correction functions preregistered in systems are determined using a calibrated
standard light source and Shimadzu's proprietary correction techniques.
If an integrating sphere is installed as an accessory, a function for creating spectrum correction
functions is included standard; this eliminates the need to install a special light source.
Note: The guarantee range of corrected spectrum is from 250 nm to 850 nm.
Window for Creating
Spectrum Correction Functions
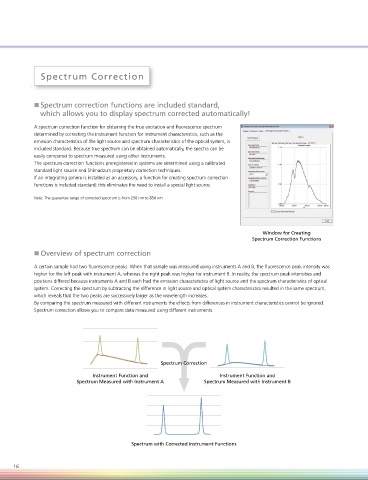
■ Overview of spectrum correction
A certain sample had two fluorescence peaks. When that sample was measured using instruments A and B, the fluorescence peak intensity was
higher for the left peak with instrument A, whereas the right peak was higher for instrument B. In reality, the spectrum peak intensities and
positions differed because instruments A and B each had the emission characteristics of light source and the spectrum characteristics of optical
system. Correcting the spectrum by subtracting the difference in light source and optical system characteristics resulted in the same spectrum,
which reveals that the two peaks are successively larger as the wavelength increases.
By comparing the spectrum measured with different instruments the effects from differences in instrument characteristics cannot be ignored.
Spectrum correction allows you to compare data measured using different instruments.
Spectrum Correction
Instrument Function and Instrument Function and
Spectrum Measured with Instrument A Spectrum Measured with Instrument B
Spectrum with Corrected Instrument Functions
16