Page 16 - Shimadzu MXF-2400
P. 16

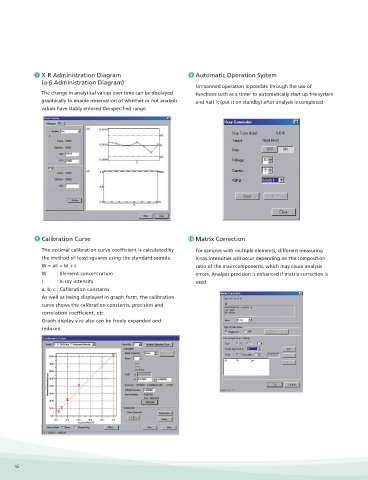
7  X-R Administration Diagram                      8  Automatic Operation System                                         11  Qualitative Analysis                           13  Four Types of Matching Functions
               (α-β Administration Diagram)
                                                                  Unmanned operation is possible through the use of                      The scanner is used to perform qualitative analysis and the   1) Impurity Judgment
               The change in analytical values over time can be displayed   functions such as a timer to automatically start up the system   profiles will be displayed and can be printed out.  Compares the unknown sample with standard sample
               graphically to enable observation of whether or not analysis   and halt it (put it on standby) after analysis is completed.  Also, analysis result reports can be created with profile   values to judge whether or not it belongs to the same
               values have stably entered the specified range.                                                                           images if the data is combined with a tool like Word Pad.  form.
                                                                                                                                                                                            2) Product Type Classification
                                                                                                                                                                                              Registers element standard values and tolerance of
                                                                                                                                                                                              multiple forms to judge what form the unknown
                                                                                                                                                                                              sample is.
                                                                                                                                                                                            3) Form Judgment
                                                                                                                                                                                              Registers the element content range for multiple forms
                                                                                                                                                                                              to judge what form the unknown sample is.
                                                                                                                                                                                            4) Matching Search
                                                                                                                                                                                              Registers the standard values for multiple forms and
                                                                                                                                                                                              searches for a match with the least differences
                                                                                                                                                                                              between unknown sample and standard values.


             9  Calibration Curve                              10  Matrix Correction                                                   12  Quantitative Analysis Possible using
                                                                                                                                         FP Method
               The optimal calibration curve coefficient is calculated by   For samples with multiple elements, different measuring
                                                                                                                                         Quantitative analysis is possible with the FP method –
               the method of least squares using the standard sample.  X-ray intensities will occur depending on the composition
                                                                                                                                         which does not need a standard sample – using the
               W = aI 2  + bI + c                                 ratio of the main components, which may cause analysis
                                                                                                                                         scanner and fixed beam monochromators.
               W       : Element concentration                    errors. Analysis precision is enhanced if matrix correction is
               I          : X-ray intensity                       used.
               a, b, c : Calibration constants
               As well as being displayed in graph form, the calibration
               curve shows the calibration constants, precision and
               correlation coefficient, etc.
               Graph display size also can be freely expanded and
               reduced.


                                                                                                                                                                                                                            MXF-2400
      16                                                                                                                                                                                                             Multi-Channel X-ray Fluorescence Spectrometer  17
   11   12   13   14   15   16   17   18   19   20   21