
Page 15 - Shimadzu MXF-2400
P. 15
High Level Data Processing
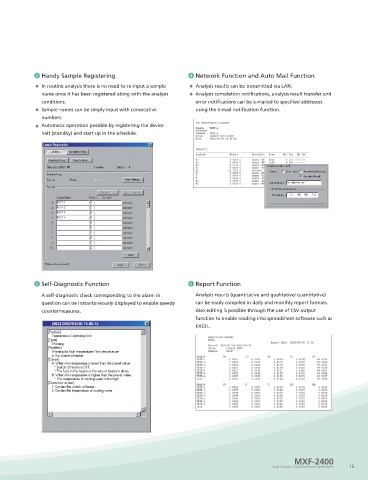
The data processing unit, which uses an IBM PC/AT compatible personal computer, performs all of the control, operation, and 3 Handy Sample Registering 4 Network Function and Auto Mail Function
processing of data of the MXF-2400. The operation is all carried out through a personal computer. The available functions In routine analysis there is no need to re-input a sample Analysis results can be transmitted via LAN.
include control and operation of the instrument, calculation of concentrations, and filling of analysis data.
name once it has been registered along with the analysis Analysis completion notifications, analysis result transfer and
conditions. error notifications can be e-mailed to specified addresses
Sample names can be simply input with consecutive using the e-mail notification function.
Quantitative Calculation numbers.
Various calculation methods are selectable; you can select the method that is most suitable for your sample type and purpose of Automatic operation possible by registering the device
analysis. halt (standby) and start up in the schedule.
X-ray intensity
measurement
Drift correction I = aIo + ß a/ ß correction of X-ray intensity (kcps)
Overlap correction
Spectrum overlapping is corrected and background
Quantitative Analysis Background suppression R = Io n 2 suppressed.
I = Io – K1I1 – K2I2
Correction with internal
The ratio of scattered X-ray intensity and element
standard (Ratio method)
concentration is obtained.
Ir
Calibration curve
Wi = Xi + ΣKjIj
Correction for absorption Wi = aI + bI + c X-ray intensities are converted into concentration values.
Correction is made for absorption, enhancement,
and enhancement Wi = Xi (l + ΣdjWj) ΣljWj and overlapping due to matrix effects.
Presentation I : X-ray intensity K : Coefficient α,β : Drift correction factors
(Printout) of data dj : Absorption/enhancement correction factor a, b, c, d : Calibration factors Ij : Overlap correction factor
W : Element concentration j : Coexisting elemen i : Analytical element n : Ratio coefficient
5 Self-Diagnostic Function 6 Report Function
Operation for Data Processing
A self-diagnostic check corresponding to the alarm in Analysis results (quantitative and qualitative/ quantitative)
All the operation is made via a personal computer. The operation is exceedingly easy. Shown below are some typical display
question can be instantaneously displayed to enable speedy can be easily compiled in daily and monthly report formats.
images.
countermeasures. Also editing is possible through the use of CSV output
function to enable reading into spreadsheet software such as
1 Menu EXCEL.
Large icon display makes for excellent operability.
2 Analysis Screen
The analysis screen mainly comprises three windows:
sample name input, analysis schedule and result display.
Just input the analysis group and sample name and click
on the Start button to effortlessly perform analysis.
MXF-2400
14 Multi-Channel X-ray Fluorescence Spectrometer 15