
Page 19 - Shimadzu IRAffinity-1S
P. 19
Software Options
LabSolutions IR incorporates data processing functions such as Advanced ATR correction and Kubelka-Munk conversion, quantitation LabSolutions IR
functions such as the multi-point calibration curve method and the CLS method, as well as the spectral searching function as Curve-Fitting (Peak-Splitting) program (P/N 206-74561-91)
standard features. However, adding the following optional software products makes it possible to further increase the application
range.
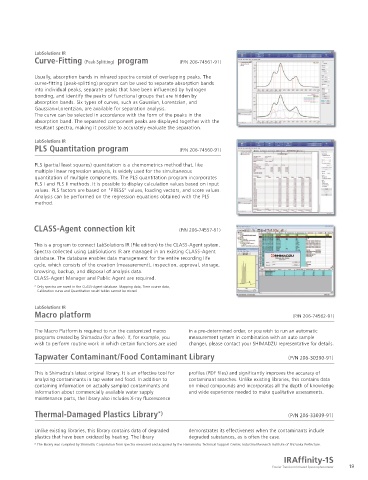
Usually, absorption bands in infrared spectra consist of overlapping peaks. The
curve-fitting (peak-splitting) program can be used to separate absorption bands
into individual peaks, separate peaks that have been influenced by hydrogen
bonding, and identify the peaks of functional groups that are hidden by
absorption bands. Six types of curves, such as Gaussian, Lorentzian, and
Gaussian+Lorentzian, are available for separation analysis.
The curve can be selected in accordance with the form of the peaks in the
absorption band. The separated component peaks are displayed together with the
LabSolutions IR resultant spectra, making it possible to accurately evaluate the separation.
Time course software (P/N 206-74558-91)
LabSolutions IR
The time course program is used to collect spectra in regular intervals and creates a PLS Quantitation program (P/N 206-74560-91)
time course dataset used to follow reactions as a function of time. Changes in peak
height and peak area can be used to calculate values related to reaction kinetics.
Time course information is saved and displayed in 3D (bird's eye view) or in a PLS (partial least squares) quantitation is a chemometrics method that, like
contour plot. It can be recalculated by modifying parameters. multiple linear regression analysis, is widely used for the simultaneous
quantitation of multiple components. The PLS quantitation program incorporates
The scan interval is dependent on resolution, number of scans and mirror speed. PLS I and PLS II methods. It is possible to display calculation values based on input
-1
The fastest speed under a 16cm resolution and a mirror speed of 9mm/s is 7 values. PLS factors are based on "PRESS" values, loading vectors, and score values.
seconds for 1 accumulated scan. Maximum measurement time is 48 hours but Analysis can be performed on the regression equations obtained with the PLS
it depends on scan parameters. The time course software includes a 3D method.
Processing program.
LabSolutions IR CLASS-Agent connection kit (P/N 206-74557-91)
Mapping program (P/N 206-74559-91)
This is a program to connect LabSolutions IR (File edition) to the CLASS-Agent system.
The Mapping software allows one to map absorption information on a sample Spectra collected using LabSolutions IR are managed in an existing CLASS-Agent
surface as a function of position when using the Shimadzu AIM-8800 Infrared database. The database enables data management for the entire recording life
Microscope. cycle, which consists of the creation (measurement), inspection, approval, storage,
Mapping parameters, such as the mapping range, the scan intervals, and the browsing, backup, and disposal of analysis data.
background positions, can be set on the composite images. Area mapping, line CLASS-Agent Manager and Public Agent are required.
mapping and random mapping modes are supported. * Only spectra are saved in the CLASS-Agent database. Mapping data, Time course data,
In addition to mapping in the conventional transmittance and reflectance modes, Calibration curve and Quantitation result tables cannot be stored.
micro-ATR mapping with an optional ATR objective is also available. From the
acquired mapping data, it is possible to extract spectra and to perform
calculations for functional-group mappings for specific peaks. The data can be LabSolutions IR
displayed as 3D images or contour plots, or in spectral overlay mode. Macro platform (P/N 206-74562-91)
Mapping program includes a 3D Processing program.
The Macro Platform is required to run the customized macro in a pre-determined order, or you wish to run an automatic
programs created by Shimadzu (for a fee). If, for example, you measurement system in combination with an auto sample
LabSolutions IR wish to perform routine work in which certain functions are used changer, please contact your SHIMADZU representative for details.
3D processing program (P/N 206-74563-91) Tapwater Contaminant/Food Contaminant Library ʢ1 / ʣ
The 3D processing program offers the following functionality
This is Shimadzu's latest original library. It is an effective tool for profiles (PDF files) and significantly improves the accuracy of
Changes the method of displaying data analyzing contaminants in tap water and food. In addition to contaminant searches. Unlike existing libraries, this contains data
• Data can be displayed in bird's eye view (3D), as an intensity distribution or containing information on actually sampled contaminants and on mixed compounds and incorporates all the depth of knowledge
using contour lines, as a spectral overlay, or rotated. information about commercially available water supply and wide experience needed to make qualitative assessments.
3D data processing maintenance parts, the library also includes X-ray fluorescence
• Changes at specific wavenumbers can be isolated.
• Functions include data extraction, data points thinning, smoothing, Thermal-Damaged Plastics Library *)
zero-baseline, background correction, normalization, log conversion, first- or ʢ1 / ʣ
second-order derivative, and ATR correction.
Creation of 3D data from spectra * The 3D processing program cannot control mapping Unlike existing libraries, this library contains data of degraded demonstrates its effectiveness when the contaminants include
• Spectra measured at fixed intervals, such as by repeated measurements, can measurements or AIM-8800 series infrared microscopes. plastics that have been oxidized by heating. The library degraded substances, as is often the case.
be arranged consecutively to create 3D data. * The library was compiled by Shimadzu Corporation from spectra measured and acquired by the Hamamatsu Technical Support Center, Industrial Research Institute of Shizuoka Prefecture.
IRAffinity-1S
18 Fourier Transform Infrared Spectrophotometer 19