
Page 17 - Shimadzu IRAffinity-1S
P. 17
Further LabSolutions IR Features
LabSolutions IR is network-enabled and features extensive libraries, high-performance search functions, and Macro functions for
automation and labor-saving, but that's not all.
It is also loaded with a variety of functions that enable infrared spectrometry to be performed easily, conveniently, and reliably.
Spectrum Measurement Quantitative Measurement
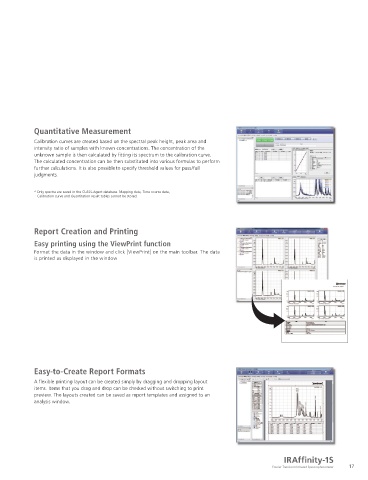
Large and Easy-to-See Measurement Buttons Calibration curves are created based on the spectral peak height, peak area and
Large, easy-to-see buttons are available for spectrum measurement and other intensity ratio of samples with known concentrations. The concentration of the
unknown sample is then calculated by fitting its spectrum to the calibration curve.
measurement programs. These buttons turn green if measurement is enabled, and The calculated concentration can be then substituted into various formulas to perform
when clicked, the measurement will start. Particularly when ATR attachments are
used, background measurement and sample measurements can be started directly further calculations. It is also possible to specify threshold values for pass/fail
while performing monitoring measurements. The time remaining until the end of judgments.
the measurement is also displayed.
* Only spectra are saved in the CLASS-Agent database. Mapping data, Time course data,
Calibration curve and Quantitation result tables cannot be stored.
Postrun Analysis Report Creation and Printing
Rich Data Processing Functions Easy printing using the ViewPrint function
a
ta
LabSolutions IR incorporates various data processing functions needed for spectral Format the data in the window and click [ViewPrint] on the main toolbar. The data
analysis. In addition to simple operations on data and constants and operations is printed as displayed in the window
between data, such as addition, subtraction, multiplication, and division, it also
includes special data processing functions such as advanced ATR correction and
Kubelka-Munk conversions. The two most recently data processing operations are
displayed in the main toolbar, so frequently used data processing functions can be
easily selected.
Photometric Measurement
This program is used to read the absorbance, transmittance, peak heights, peak areas,
and their ratios at specific wavenumbers. Then the read values can be entered in
various formulas to perform calculations. It is also possible to specify threshold values
for pass/fail judgments. These features are convenient for calculating saponification,
reaction ratios, component ratios, and so on. Easy-to-Create Report Formats
A flexible printing layout can be created simply by dragging and dropping layout
items. Items that you drag and drop can be checked without switching to print
* Only spectra are saved in the CLASS-Agent database. Mapping data, Time course data, preview. The layouts created can be saved as report templates and assigned to an
Calibration curve and Quantitation result tables cannot be stored.
analysis window.
IRAffinity-1S
16 Fourier Transform Infrared Spectrophotometer 17