
Page 27 - Application Notebook - Solution for Food Development
P. 27
LAAN-A-LC-E248
Application High Performance Liquid Chromatography
News Comprehensive Two-Dimensional Analysis of Polyphenols
in Red Wine Using Nexera-e Coupled with SPD-M30A
No.L471
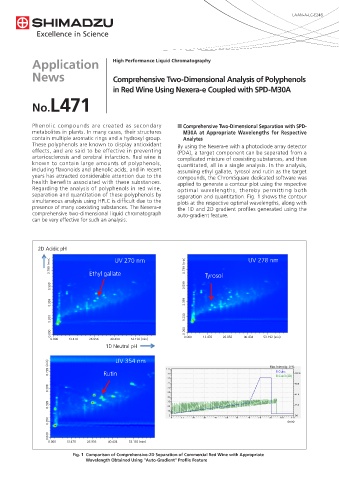
Phenolic compounds are created as secondary n Comprehensive Two-Dimensional Separation with SPD-
metabolites in plants. In many cases, their structures M30A at Appropriate Wavelengths for Respective
contain multiple aromatic rings and a hydroxyl group. Analytes
These polyphenols are known to display antioxidant By using the Nexera-e with a photodiode array detector
effects, and are said to be effective in preventing (PDA), a target component can be separated from a
arteriosclerosis and cerebral infarction. Red wine is complicated mixture of coexisting substances, and then
known to contain large amounts of polyphenols, quantitated, all in a single analysis. In the analysis,
including flavonoids and phenolic acids, and in recent assuming ethyl gallate, tyrosol and rutin as the target
years has attracted considerable attention due to the compounds, the ChromSquare dedicated software was
health benefits associated with these substances. applied to generate a contour plot using the respective
Regarding the analysis of polyphenols in red wine, optimal wavelengths, thereby permitting both
separation and quantitation of these polyphenols by separation and quantitation. Fig. 1 shows the contour
simultaneous analysis using HPLC is difficult due to the plots at the respective optimal wavelengths, along with
presence of many coexisting substances. The Nexera-e the 1D and 2D gradient profiles generated using the
comprehensive two-dimensional liquid chromatograph auto-gradient feature.
can be very effective for such an analysis.
2D Acidic pH
ʢminʣ UV 270 nm ʢminʣ UV 278 nm
0.799 Ethyl gallate 0.799 Tyrosol
0.599 0.599
0.399 0.399
0.200 0.200
0.000 0.000
0.000 13.478 26.956 40.434 53.192 min 0.000 13.478 26.956 40.434 53.192 min
1D Neutral pH
ʢminʣ UV 354 nm Max Intensity: 0 %
0.799 Rutin B.Conc.
B.Con3 (2D)
0.599
0.399
0.200 min
0.000
0.000 13.478 26.956 40.434 53.192 min
Fig. 1 Comparison of Comprehensive-2D Separation of Commercial Red Wine with Appropriate
Wavelength Obtained Using "Auto-Gradient" Profile Feature