Page 14 - LifeScience Solution for Lipid and Lipidome
P. 14

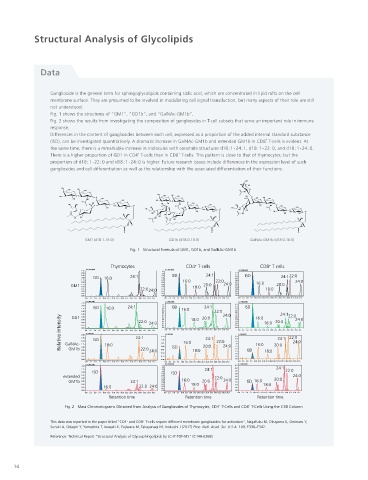
Structural Analysis of Glycolipids


              Data                                                                                                                                                                                                                             Subcutaneous Tissue  Mass Imaging of
                                                                                                                                      Glycolipids are molecules with a sugar chain bonded to a lipid, where
                                                                                                                                      the lipid portion interacts with biological membranes and the sugar   HO  OH  HO  OH
                                                                                                                                                                                                     OH     O      O
                  Ganglioside is the general term for sphingoglycolipids containing sialic acid, which are concentrated in lipid rafts on the cell   portion protrudes outside the cell. Sugar chains are recognized by sugar   HO  OH  O  O  O
                  membrane surface. They are presumed to be involved in modulating cell signal transduction, but many aspects of their role are still   chain-recognizing molecules and serve a variety of biological functions,   HO  O  OH  O  NH  O  OH  O  OH  Analysis of
                  not understood.                                                                                                     such as cell-cell recognition, signal transduction, bacterial and viral   HO  OH  O  OH  O     O           Comprehensive
                                                                                                                                                                                          O  N  HO                   O        HO        O
                  Fig. 1 shows the structures of “GM1”, “GD1b”, and “GalNAc-GM1b”.                                                    adhesion, and bonding with toxins. Until now, the structure of sugar   H    O        OH       OH       Glycerophospholipids
                                                                                                                                                                                                           O  HO
                  Fig. 2 shows the results from investigating the composition of gangliosides in T-cell subsets that serve an important role in immune   chains could be predicted in minute quantities using antibodies or        H  OH
                  response.                                                                                                           lectin, a sugar chain-recognizing molecule. However, with almost no    N H  HO
                  Differences in the content of gangliosides between each cell, expressed as a proportion of the added internal standard substance   way to predict the structure of the lipid portion, glycolipids with             NH H
                                                                                         +
                  (ISD), can be investigated quantitatively. A dramatic increase in GalNAc-GM1b and extended GM1b in CD8  T-cells is evident. At   uniform sugar chains and a mixture of different lipids were commonly
                  the same time, there is a remarkable increase in molecules with ceramide structures d18:1-24:1, d18:1-22:0, and d18:1-24:0.   used. Using an LCMS-IT-TOF system allows identification of not only the            O
                                                            +
                                               +
                  There is a higher proportion of GD1 in CD4  T-cells than in CD8  T-cells. This pattern is close to that of thymocytes, but the   sugar chain structure, but also the structure of the lipid portion, even in               Technology
                  proportion of d18:1-22:0 and d18:1-24:0 is higher. Future research issues include differences in the expression level of such   mixtures containing trace quantities of biological samples.  GD1a(d18:1-16:0)                Supercritical Fluid   Lipid Analysis Using
                  gangliosides and cell differentiation as well as the relationship with the associated differentiation of their functions.
                                                                                  OH
                                                                                 HO  OH
                     HO
                        OH   HO   OH                                            O   O
                         O     O                                                  NH
                                                     HO  OH  HO
                     HO    O     O                       O  OH   O                HO  O  OH  HO
                         OH   NH   OH   O  OH        HO                           O    O  OH   O
                            O              O              O    O                        O
                        HO   OH  O  OH  O             HO  OH  NH  OH   O  OH   HO   O  O  OH  O                                                                                                                                                  Analysis of
                                O      HO    O        O    O            O                 NH   OH
                                    OH    OH     HO  HO  O  O  O  OH  O  O HO  O  HO  HO   O   O   OH  O
                        O  HO  O                   HO             OH   OH      O  OH        HO  OH    O HO  OH   O
                                          H  OH         HO   HO  O               NH                                                                                                                                                            Glycerophospholipids
                                                     HO                H
                          N  HO                     NH  O               OH
                          H                       O      N                                         H  OH
                                                         H  HO
                                           NH H                         NH H                        NH  H                                   Unique Ion TRAP Technology
                                          O                            O                            O
                             GM1 (d18:1-16:0)            GD1b (d18:0-18:0)          GalNAc-GM1b (d18:0-16:0)                                LCMS-IT-TOF systems are liquid chromatograph mass spectrometer systems that combine a high performance liquid chromatograph
                                                                                                                                            (HPLC), ion trap mass spectrometer (IT), and time-of-flight mass spectrometer (TOF) in a single integrated system. Combining the
                                            Fig. 1   Structural Formula of GM1, GD1b, and GalNAc-GM1b
                                                                                                                                            MS  capability of the IT unit with the high resolution and accurate mass measurement capability of the TOF unit achieves highly
                                                                                                                                              n
                                                                                                                                                    n
                                                                                                                                            accurate MS  mass measurements not possible with conventional LC/MS/MS systems.                  Blood Serum  Analysis of Lipid
                                                                                          +
                                                                  +
                                      Thymocytes               CD4 T cells             CD8 T cells                                                                                                                                             Mediators in Human
                              (×1,000,000)              (×1,000,000)
                            2.75                       1.1                      (×1,000,000)
                            2.50                       1.0                     1.2
                            2.25            24:1       0.9  ISD      24:1      1.1 1.0  ISD   24:1 22:0
                            2.00  ISD  16:0            0.8                     0.9
                            1.75                       0.7   16:0       22:0   0.8                                                                              CDL         DQarray  Octopole lens  Ion trap   Flight tube with
                            1.50                       0.6                     0.7    16:0         24:0
                        GM1  1.25                      0.5 0.4   18:0  20:0  24:0  0.6 0.5   20:0                                                                                                              temperature control
                            1.00
                            0.75               22:0 24:0  0.3                  0.4 0.3   18:0
                            0.50                       0.2                     0.2
                            0.25                       0.1                     0.1
                            0.00                       0.0                     0.0
                             0.0  2.5  5.0  7.5  10.0 12.5 15.0 17.5 20.0 22.5 25.0 27.5 30.0 32.5 35.0 37.5  0.0  2.5  5.0  7.5  10.0 12.5 15.0 17.5 20.0 22.5 25.0 27.5 30.0 32.5 35.0 37.5  0.0  2.5  5.0  7.5  10.0 12.5 15.0 17.5 20.0 22.5 25.0 27.5 30.0 32.5 35.0 37.5
                             (×1,000,000)               (×1,000,000)            (×1,000,000)
                            2.25                                               1.2
                            2.00           24:1        1.1 1.0  ISD  24:1      1.1  ISD
                            1.75  ISD  16:0            0.9   16:0              1.0
                            1.50                       0.8 0.7          22:0   0.9 0.8                                                                                                                                                         of Glycolipids
                                                                                              24:1
                            1.25               22:0  24:0  0.6 0.5 0.4 0.3 0.2  18:0  20:0  24:0  0.7 0.6 0.5 0.4 0.3  16:0 18:0  20:0  22:0 24:0                                                                                                Structural Analysis
                     Relative intensity  0.25  0.0 (×1,000,000) ISD 7.5  10.0  12.5  15.0  17.5  20.0  22.5  25.0  27.5 24:1 32.5  35.0  37.5  1.75 0.1 0.0  0.0 (×1,000,000)  5.0  7.5  10.0 16:0 15.0  17.5  20.0  22.5  25.0 24:1 30.0 22:0 35.0  37.5  0.2 0.1 0.0 4.5 4.0 3.5  0.0 (×1,000,000) 5.0  7.5  10.0  12.5  15.0  17.5  20.0  22.5 24:1 22:0 35.0  37.5  Atmospheric Ionization Probe  Skimmer  Lens  Detector  Dual-Stage Re ectron
                         GD1
                            1.00
                            0.75
                            0.50
                            0.00
                                                                         32.5
                                                                                                 32.5
                                                                      27.5
                                                              12.5
                                                         2.5
                                                                                 2.5
                                                                                               27.5
                                                                                             25.0
                                                                                                30.0
                                               30.0
                                5.0
                               2.5
                            2.00
                            1.75
                                                      1.50
                                                                                                  24:0
                            1.50
                       GalNAc-
                                                      1.25
                            1.25
                            1.00
                        GM1b
                            0.75
                                                      0.75
                                                      0.50
                            0.50    16:0        22:0 24:0  1.00  ISD  18:0  20:0  24:0  3.0 2.5 2.0 1.5 1.0  ISD  16:0  18:0  20:0
                            0.25                      0.25                     0.5
                            0.00                      0.00                     0.0
                             0.0  2.5  5.0  7.5  10.0 12.5 15.0 17.5 20.0 22.5 25.0 27.5 30.0 32.5 35.0 37.5  0.0  2.5  5.0  7.5  10.0 12.5 15.0 17.5 20.0 22.5 25.0 27.5 30.0 32.5 35.0 37.5  0.0  2.5  5.0  7.5 10.0 12.5 15.0 17.5 20.0 22.5 25.0 27.5 30.0 32.5 35.0 37.5
                                                        (×1,000,000)            (×1,000,000)                                                                                                                                                     Analysis of Fatty Acid
                             (×1,000,000)
                            2.00                       1.3                     4.5
                                                       1.2                                   24:1                                                                                                                                            Content of Human ES Cells
                            1.75                       1.1           24:1      4.0              22:0                                                                                                                                           Composition in Overall Lipid
                            1.50  ISD                  1.0 0.9  ISD            3.5 3.0
                      extended  1.25                   0.8 0.7 0.6      22:0   2.5          20:0  24:0
                            1.00
                        GM1b  0.75          24:1       0.5   16:0   20:0   24:0  2.0 1.5  ISD 16:0
                            0.50                       0.4 0.3  18:0           1.0      18:0
                            0.25   16:0        22:0 24:0  0.2 0.1              0.5
                            0.00                       0.0                     0.0
                             0.0  2.5  5.0  7.5  10.0 12.5 15.0 17.5 20.0 22.5 25.0 27.5 30.0 32.5 35.0 37.5  0.0  2.5  5.0  7.5  10.0 12.5 15.0 17.5 20.0 22.5 25.0 27.5 30.0 32.5 35.0 37.5  0.0  2.5  5.0  7.5 10.0 12.5 15.0 17.5 20.0 22.5 25.0 27.5 30.0 32.5 35.0 37.5
                                     Retention time           Retention time          Retention time
                                                                          +
                                                                                   +
                       Fig. 2   Mass Chromatograms Obtained from Analysis of Gangliosides of Thymocytes, CD4  T-Cells and CD8  T-Cells Using the C30 Column
                                                                                                                                                                                  Hybrid LC-MS/MS
                                                                                                                                                                                 LCMS-IT-TOF                                                 Esters by GC  Acid Methyl
                  This data was reported in the paper titled “CD4 +  and CD8 +  T-cells require different membrane gangliosides for activation”, Nagafuku M, Okuyama K, Onimaru Y,                                                               Analysis of Fatty
                  Suzuki A, Odagiri Y, Yamashita T, Iwasaki K, Fujiwara M, Takayanagi M, Inokuchi J (2012) Proc. Natl. Acad. Sci. U.S.A. 109, E336–E342.
                  Reference: Technical Report “Structural Analysis of Glycosphingolipids by LC-IT-TOF-MS” (C146-E268)                       Reference: LCMS-IT-TOF brochure (C146-E093)
      14                                                                                                                                                                                                                                      15
   9   10   11   12   13   14   15   16   17   18   19