Page 10 - LifeScience Solution for Lipid and Lipidome
P. 10

Analysis of Glycerophospholipids


              Data                                                                                                                                                                                                                             Subcutaneous Tissue  Mass Imaging of
                                                                                                                                      Phospholipidosis is an excessive accumulation of phospholipids in the lysosomes
                                                                                                                                      of cells that is induced by pathological conditions or medications. It is
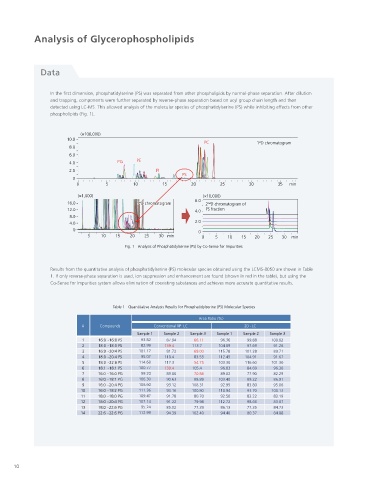
                  In the first dimension, phosphatidylserine (PS) was separated from other phospholipids by normal-phase separation. After dilution   characterized by lamellar bodies observed inside lysosomes. Many drugs with a
                  and trapping, components were further separated by reverse-phase separation based on acyl group chain length and then   cationic amphiphilic structure (cationic amphiphilic drugs) are known to cause                       Analysis of
                  detected using LC-MS. This allowed analysis of the molecular species of phosphatidylserine (PS) while inhibiting effects from other   drug-induced phospholipidosis. The clinical problem with drug-induced                    Comprehensive
                  phospholipids (Fig. 1).                                                                                             phospholipidosis is that the drugs that induce the condition can cause adverse                         Glycerophospholipids
                                                                                                                                      side-effects in humans, such as disorder of the liver, lungs, spleen, or other
                                                                                                                                      organs. Consequently, drug-induced phospholipidosis is attracting considerable
                            (×100,000)                                                                                                attention with respect to drug safety. From a clinical perspective, it is important
                       10.0
                                                                     PC               1 D chromatogram                                to evaluate the organs for any functional disabilities and search for biomarkers.
                                                                                       st
                        8.0                                                                                                           However, there is still much that is unknown about the induction mechanism of
                        6.0                                                                                                           drug-induced phospholipidosis. From a basic research perspective, the major                            Technology
                        4.0             PG    PE                                                                                      issue is determining the induction mechanism.                                                            Supercritical Fluid   Lipid Analysis Using
                        2.0                          PI
                                                             PS
                         0
                          0         5        10        15       20        25        30       35  min
                           (×1,000)                                 (×10,000)
                                                                  6.0
                       16.0                   1 D chromatogram 1 D chromatogram   2 D chromatogram of                                       Co-Sense Technology                                                                                  Analysis of
                                               st st
                                                                      nd
                       12.0                                       4.0  PS fraction
                        8.0                                                                                                                 Co-Sense series systems only inject a portion of the solution   Pump unit for first                Glycerophospholipids
                                                                                                                                                                                           dimension separation
                        4.0                                       2.0                                                                       separated by the first-dimensional column into the                First dimension
                                                                                                                                                                                                        Autosampler
                         0                                         0                                                                        second-dimensional column. Compared to comprehensive              separation column
                              5    10  15   20   25   30 min        0   5   10   15  20   25  30  min                                       2D-LC systems, this allows use of a longer second-dimension
                                                                                                                                            column that is able to separate components more efficiently.
                                          Fig. 1   Analysis of Phosphatidylserine (PS) by Co-Sense for Impurities                                                                                                    Concentration column
                                                                                                                                            Therefore, it is especially useful for analyzing the molecular
                                                                                                                                            species of target phospholipids in more detail, such as   Pump unit for on-line                  Blood Serum
                                                                                                                                            phosphatidylserine (PS).                                  concentration                            Mediators in Human   Analysis of Lipid
                  Results from the quantitative analysis of phosphatidylserine (PS) molecular species obtained using the LCMS-8050 are shown in Table   The Co-Sense for Impurities system can be used to separate
                  1. If only reverse-phase separation is used, ion suppression and enhancement are found (shown in red in the table), but using the   phospholipids by normal-phase LC in the first dimension and   Second dimension
                  Co-Sense for Impurities system allows elimination of coexisting substances and achieves more accurate quantitative results.  further separate them according to the carbon chain length of   Detector  separation column
                                                                                                                                            fatty acids by reverse-phase LC in the second dimension. This              Pump unit for second
                                                                                                                                                                                                                       dimension separation
                                                                                                                                            makes it possible to fully automate the previously manual
                                                                                                                                            process of TLC separation, recovery from TLC plates, and then
                                      Table 1   Quantitative Analysis Results for Phosphatidylserine (PS) Molecular Species
                                                                                                                                            separation by reverse-phase LC.                                                                    of Glycolipids
                                                                   Area Ratio (%)                                                                                                                                                                Structural Analysis
                            #     Compounds         Conventional RP  LC           2D -LC
                                               Sample 1  Sample 2  Sample 3  Sample 1  Sample 2  Sample 3
                            1     16:0-16:0 PS  93.82   87.94    66.11    96.36    99.88   100.02
                            2     18:0-18:0 PS  82.99  139.4     113.7   104.89    97.69    91.26
                            3     16:0-20:4 PS  101.17  81.72    69.00   115.78   101.28    89.71
                            4     18:0-20:4 PS  95.07  110.4     83.55   112.45   104.91    91.67
                            5     18:0-22:6 PS  114.68  117.3    54.75   103.30   116.60   101.30                                                                                                                                                Analysis of Fatty Acid
                            6     18:1-18:1 PS  100.77  139.4    105.4    96.83    84.69    96.30                                                                                                                                            Content of Human ES Cells  Composition in Overall Lipid
                            7     16:0-16:0 PG  99.20   89.06    70.86    89.02    77.90    82.29
                            8     16:0-18:1 PG  106.30  90.63    88.89   103.40    89.22    86.91
                            9     16:0-20:4 PG  106.60  93.12    108.31   92.95    83.80    95.06
                            10    16:0 -18:2 PG  111.36  93.16   100.80  110.94    93.70   100.13
                            11    18:0 -18:0 PG  109.47  91.78   80.70    92.50    83.22    83.19
                            12    18:0 -20:4 PG  107.14  91.22   79.98   112.72    98.66    83.67
                            13    18:0 -22:6 PG  95.24  85.02    77.39    86.13    77.35    84.73
                            14    22:6 -22:6 PG  112.99  94.39   102.40   94.40    80.37    84.88                                                       High-Performance Liquid Chromatograph  High-Throughput Liquid Chromatograph Mass Spectrometer  Esters by GC  Acid Methyl
                                                                                                                                                        Co-Sense for Impurities                       LCMS-8060                                  Analysis of Fatty


                                                                                                                                            Reference: Co-Sense Series brochure (C196-E089), LCMS-8060 brochure (C146-E286)


      10                                                                                                                                                                                                                                      11
   5   6   7   8   9   10   11   12   13   14   15