
Page 7 - LifeScience Solution for Lipid and Lipidome
P. 7
Comprehensive Analysis of Glycerophospholipids
Data Subcutaneous Tissue Mass Imaging of
According to Alzheimer’s Disease International, there were an estimated
35,600,000 known Alzheimer patients in 2010, world-wide, with the number
Results from comprehensive analysis of glycerophospholipids are shown in Fig. 1. The first dimension (normal-phase LC) separates of patients doubling every 20 years. By 2050, the number is expected to
samples by glycerophospholipid type. The second dimension (reverse-phase LC) separates samples by acyl group chain length. The increase to an estimated 115,400,000 patients. Biomarkers such as the tau and Analysis of
specialized ChromSquare software visually displays data analysis results two-dimensionally. This allows the user to get a broad-based beta-amyloid concentrations in the cerebrospinal fluid, positron emission Comprehensive
understanding of the types and ratios of glycerophospholipids present and the molecular species in each glycerophospholipid. tomography (PET), and so on are being used for detection of early-stage Glycerophospholipids
Therefore, it is ideal for the comprehensive analysis of glycerophospholipids. Alzheimer’s disease, but use of these means is limited by problems such as
being invasive, time-consuming, and expensive. Therefore, to search for other
Alzheimer biomarkers, M. Mapstone, et al, studied use of lipidomics to identify
PE group
2D a pre-clinical stage Alzheimer’s group among a group of elderly subjects with
18:0p-18:1 PC normal cognitive abilities.* Their results reported certain phosphatidylcholines
(PCs), such as PC diacyl(aa) C36:6, PC aa C38:0, PC aa C38:6, PC aa 40:1, PC Technology
18:0-18:1 PC
aa C40:2, and PC aa C40:6, as potential biomarker candidates. Supercritical Fluid Lipid Analysis Using
16:0-16:0 PC
* Nature Medicine Volume: 20, pp. 415–418 (2014)
PI group
PS group
PC group
PG group Analysis of
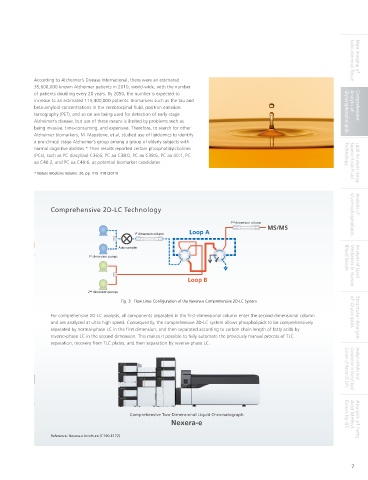
Comprehensive 2D-LC Technology
1D Glycerophospholipids
2 nd dimension column
MS/MS
Loop A
Fig. 1 ChromSquare Plot of Phospholipids Two-Dimensionally Separated by Positive-Mode MRM 1 st dimension column
A standard sample was prepared with phosphatidylglycerol (PG), phosphatidyl ethanolamine (PE), phosphatidylinositol (PI), Auto sampler
phosphatidylserine (PS), and phosphatidylcholine (PC), each at a concentration of 500 µg/L. 1 st dimension pumps Blood Serum
The ESI-positive mode MRM analysis separated the PG, PE, PI, PS, and PC. Results from identifying the molecular species of PC are Mediators in Human Analysis of Lipid
shown in Fig. 1.
Three compounds in the PC group shown in Fig. 1 were used as the basis for quantitative analysis. The 5-cycle repeatability and Loop B
the linearity of six points within the 50 to 5000 µg/L range for the numeric value (blob area) corresponding to the peak volume of
the applicable compound are indicated in Fig. 2 and Table 1. 2 nd dimension pumps
Fig. 3 Flow Lines Configuration of the Nexera-e Comprehensive 2D-LC System
Area
For comprehensive 2D-LC analysis, all components separated in the first-dimensional column enter the second-dimensional column of Glycolipids Structural Analysis
and are analyzed at ultra high speed. Consequently, the comprehensive 2D-LC system allows phospholipids to be comprehensively
separated by normal-phase LC in the first dimension, and then separated according to carbon chain length of fatty acids by
reverse-phase LC in the second dimension. This makes it possible to fully automate the previously manual process of TLC
separation, recovery from TLC plates, and then separation by reverse-phase LC.
Conc. (µg/L) Analysis of Fatty Acid
Fig. 2 Linearity of PC (18:0-18:1) Content of Human ES Cells Composition in Overall Lipid
Table 1 Retention Time and Area Reproducibility of Five Repetitions for Three PC Components and Linearity of 50 to 5000 µg/L Range
Compound MRM transition Total retention time Retention time Blob Area (%RSD) Correlation
(%RSD) (2D) coef cient (R)
16:0-16:0 PC m/z 734.6 > 184.1 0.0072 0.9 6.8 0.999799
18:0-18:1 PC m/z 788.6 > 184.1 0.013 1.1 8.9 0.999947 Comprehensive Two-Dimensional Liquid Chromatograph Esters by GC Acid Methyl
Nexera-e Analysis of Fatty
18:0p-18:1 PC m/z 772.6 > 184.1 0.013 1.2 6.4 0.999656
Reference: Nexera-e brochure (C190-E172)
6 7