
Page 49 - Pharmaceutical- Guide to Biopharmaceutical
P. 49
Characterization Quality Control Pharmacokinetics
Evaluating the Concentration of Antibody Drugs in Blood LCMS-8050 / 8060 / 8060NX
LC/MS Bioanalysis of Antibody Drugs by benefits
nSMOL Fab-Specific Protein Analysis Method Cell Line Optimization
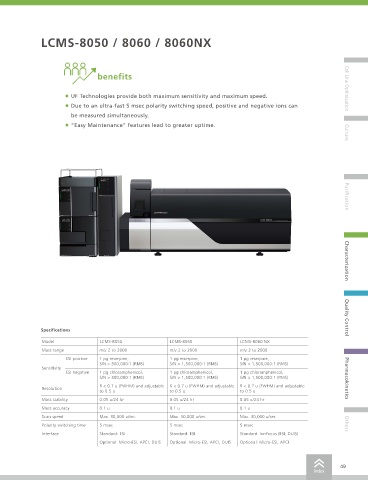
• UF Technologies provide both maximum sensitivity and maximum speed.
—Example of Trastuzumab Analysis— click here
• Due to an ultra-fast 5 msec polarity switching speed, positive and negative ions can
be measured simultaneously.
Operating Principle and Features Table 1 LC-MS Analytical Conditions • “Easy Maintenance” features lead to greater uptime.
[LC] NexeraX2 system Culture
Shimadzu’s nSMOL method is a revolutionary LC/MS pretreatment Column: Shim-pack GISS C18 (50 mm × 2.1 mm I.D.)
method that enables Fab-specific protein decomposition of monoclonal Column oven: 50 °C
antibodies. It enables the development of methods that do not depend Solvent A: 0.1 % formic acid/water
Solvent B: 0.1 % formic acid/acetonitrile
on the type of antibody drug, which represents a paradigm shift for
Gradient: 1 % (1.5 min)→ 25 % (4.0 min)→
antibody drug analysis. It also satisfies criteria specified in the Guideline (Conc. B) → 95 % (5.0 min)→ 1 % (6.0 min)
on Bioanalytical Method Validation in Pharmaceutical Development Flowrate: 0.4 mL/min
(Japanese Ministry of Health, Labour and Welfare). Shimadzu offers Injection: 10 µL
methods and protocols optimized for both. This method has been [MS] LCMS-8050, 8060
optimized for the Shimadzu LCMS-8050 and LCMS-8060 triple Ionization: ESI Positive
quadrupole mass spectrometers (referred to as “LCMS-8050” and DL: 250 °C
“LCMS-8060 (NX)” below). Heat Block: 400 °C Purification
Interface: 300 °C
Measurement Method and Conditions Nebulizer gas: 3 L/min
Drying gas:
10 L/min
Heating gas: 10 L/min
Human blood plasma spiked with trastuzumab was pretreated by the
nSMOL method and then Fab-derived peptides were obtained. Then Table 2 MRM Transitions of Quantified Peptides in Trastuzumab
the content of trastuzumab in the blood plasma was quantitatively Peptide MRM transition Purpose
analyzed by LC-MS (Table 1). The results were fully validated in P 14 R 512.1 > 292.3 (b3+) For quantitation (IS)
accordance with the Japanese Ministry of Health, Labour and Welfare 512.1 > 389.3 (b4+) For structural confirmation
Guideline on Bioanalytical Method Validation in Pharmaceutical 512.1 > 660.4 (b6+) For structural confirmation
Development. IYPTNGYTR 542.8 > 404.7 (y7++) For quantitation Characterization
542.8 > 808.4 (y7+) For structural confirmation
Results 542.8 > 610.3 (y5+) For structural confirmation
Note: Quantitation range in human blood plasma :0.0610 to 250 μg/mL
Averaged accuracy :100.7 %
The peptide to be quantified (signature peptide) is selected from trypsin
peptide fragments that include complementarity-determining regions
(CDRs) that determine antibody specificity. However, even if a peptide
contains CDRs, there is no guarantee its sequence is not identical to
endogenous IgG. That requires confirming that they do not compete
within the biological matrix used. However, given the operating
principle of mass spectrometers, they can only obtain basic m/z and Quality Control
signal intensity information. Therefore, a data analysis method able to
obtain high-quality and accurate analytical results by simultaneously Specifications
using quantitative MRM settings for bioanalysis and using MRM
monitoring for structural confirmation (Table 2 and Fig. 1) was used. Model LCMS-8050 LCMS-8060 LCMS-8060 NX
Fig. 1 MRM Chromatogram of IYPTNGYTR in Human Blood Plasma
That resulted in satisfying the Japanese Ministry of Health, Labour and Mass range m/z 2 to 2000 m/z 2 to 2000 m/z 2 to 2000
Table 3 Full Validation Results
Welfare guideline (Table 3) and obtaining a good calibration curve.
Precision and Accuracy ESI positive 1 pg reserpine, 1 pg reserpine, 1 pg reserpine,
Set Concentration (µg/mL) Data Average (N = 15) Accuracy (%) CV (%) S/N > 500,000:1 (RMS) S/N > 1,500,000:1 (RMS) S/N > 1,500,000:1 (RMS)
Conclusion 2.93 2.58 88.1 8.2 Sensitivity ESI negative 1 pg chloramphenicol, 1 pg chloramphenicol, 1 pg chloramphenicol,
200 211 106 5.6 S/N > 500,000:1 (RMS) S/N > 1,500,000:1 (RMS) S/N > 1,500,000:1 (RMS)
LC/MS quantitative analysis of antibody drugs in blood plasma (0.06 Pharmacokinetics
Freeze-thaw Test
μg/mL lower limit of quantitation) can be performed using the same Set Concentration (µg/mL) Data Average (N = 5) Accuracy (%) Temp (°C) Resolution R < 0.7 u (FWHM) and adjustable R < 0.7 u (FWHM) and adjustable R < 0.7 u (FWHM) and adjustable
assay method for everything from preclinical testing to human clinical 2.93 2.87 98.1 -20 to 0.5 u to 0.5 u to 0.5 u
trials. 200 199 99.7 -20 Mass stability 0.05 u/24 hr 0.05 u/24 hr 0.05 u/24 hr
Long-term Stability Test
Application Examples Set Concentration (µg/mL) Data Average (N = 5) Accuracy (%) Temp (°C) Mass accuracy 0.1 u 0.1 u 0.1 u
2.93 3.03 104 -20 Scan speed Max. 30,000 u/sec Max. 30,000 u/sec Max. 30,000 u/sec
• Quantitating monoclonal antibodies in blood serum or blood plasma 200 209 101 -20 Others
Processed Sample Stability for 48 Hours Polarity switching time 5 msec 5 msec 5 msec
Set Concentration (µg/mL) Data Average (N = 5) Accuracy (%) Temp (°C) Interface Standard: ESI Standard: ESI Standard: IonFocus (ESI, DUIS)
2.93 3.67 91.2 5
Optional: Micro-ESI, APCI, DUIS Optional: Micro-ESI, APCI, DUIS Optional: Micro-ESI, APCI
200 211 106 5
48 49
index index