Page 16 - Shimadzu Journal vol.9 Issue2
P. 16

Biopharmaceutical


            As shown in Fig. 6, the resolution between aggregates and mono-  mAU
                                                                      2.5                2  3       1. Aggregates
            mer, and between monomer and fragments improved at lower flow   pH 5.7                   2. Monomer
                                                                                                    3. Fragments
            rate. Based on these results, a flow rate of 0.25 mL/min was chosen   0.0
            as it provides shorter analytical time and appropriate chromato-
                                                                      2.5               2  3
            graphic separation (over 1.5 resolution).          pH 6.0           1
                                                                      0.0
                  Aggregates/Monomer  Monomer/Fragments
                                                                      2.5      1        2
               4.5                                                                         3
                                                               pH 6.3
                                                                      0.0
               3.6                                                             1        2
              Resolution  2.7                                  pH 6.6  2.5                 3
                                                                      0.0
               1.8
               0.9                                                    2.5      1        2  3
                                                               pH 6.9
               0.0                                                    0.0
                    0.10  0.15  0.20  0.25  0.30  0.35  0.40
                                  Flow rate (mL/min)                  2.5     1         2
                                                                                           3
            Fig. 6. Relationship between Flow Rate and Peak Resolution  pH 7.2
                                                                      0.0
                                                                       4.0    5.0    6.0    7.0    8.0    min
                                                               Fig. 7. Chromatograms and pH
            3-4.  Impact of Mobile Phase pH
            Due to a large number of dissociable groups on protein molecule,
                                                                    Symmetry    Aggregates/    Monomer/
            their charge state and steric structure change depending on pH.   Factor  Monomer  Fragments
            Such changes are known to contribute to protein size and the   1.8                          3.0
            strength of interaction with the column and thereby affect chroma-
                                                                 1.5                                    2.5
                                                                 Symmetry Factor  0.9                   1.5
            togram peak shapes.                                  1.2                                    2.0
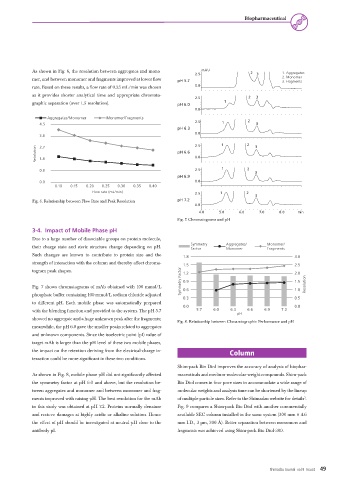
            Fig. 7 shows chromatograms of mAb obtained with 100 mmol/L   0.6                            1.0  Resolution
            phosphate buffer containing 100 mmol/L sodium chloride adjusted
                                                                 0.3                                    0.5
            to different pH. Each mobile phase was automatically prepared
                                                                 0.0                                    0.0
            with the blending function and provided to the system. The pH 5.7   5.7  6.0  6.3  6.6  6.9  7.2
                                                                                    pH
            showed no aggregate and a huge unknown peak after the fragments;
                                                               Fig. 8. Relationship between Chroamtographic Performance and pH
            meanwhile, the pH 6.0 gave the smaller peaks related to aggregates
            and unknown components. Since the isoelectric point (pI) value of
            target mAb is larger than the pH level of these two mobile phases,
            the impact on the retention deriving from the electrical-charge in-   Column
            teraction could be more significant in these two conditions.
                                                               Shim-pack Bio Diol improves the accuracy of analysis of biophar-
            As shown in Fig. 8, mobile phase pH did not significantly affected   maceuticals and medium-molecular-weight compounds. Shim-pack
            the symmetry factor at pH 6.0 and above, but the resolution be-  Bio Diol comes in four pore sizes to accommodate a wide range of
            tween aggregates and monomer and between monomer and frag-  molecular weights and analysis time can be shortened by the lineup
            ments improved with raising pH. The best resolution for the mAb   of multiple particle sizes. Refer to the Shimadzu website for details .
                                                                                                            3
            in this study was obtained at pH 7.2. Proteins normally denature   Fig. 9 compares a Shim-pack Bio Diol with another commercially
            and recieve damages at highly acidic or alkaline solution. Hence   available SEC column installed in the same system (300 mm × 4.6
            the effect of pH should be investigated at neutral pH close to the   mm I.D., 3 µm, 300 Å). Better separation between monomers and
            antibody pI.                                       fragments was achieved using Shim-pack Bio Diol-300.


                                                                                                Shimadzu Journal  vol.9  Issue2 49
   11   12   13   14   15   16   17   18   19   20   21