Page 15 - Shimadzu Journal vol.9 Issue2
P. 15

Biopharmaceutical


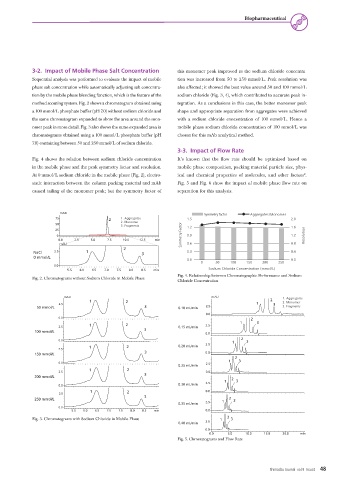
            3-2.  Impact of Mobile Phase Salt Concentration    this monomer peak improved as the sodium chloride concentra-
            Sequential analysis was performed to evaluate the impact of mobile   tion was increased from 50 to 250 mmol/L. Peak resolution was
            phase salt concentration while automatically adjusting salt concentra-  also affected; it showed the best value around 50 and 100 mmol/L
            tion by the mobile phase blending function, which is the feature of the   sodium chloride (Fig. 3, 4), which contributed to accurate peak in-
            method scouting system. Fig. 2 shows a chromatogram obtained using   tegration. As a conclusions in this case, the better monomer peak
            a 100 mmol/L phosphate buffer (pH 7.0) without sodium chloride and   shape and appropriate separation from aggregates were achieved
            the same chromatogram expanded to show the area around the mon-  with a sodium chloride concentration of 100 mmol/L. Hence a
            omer peak in more detail. Fig. 3 also shows the same expanded area in   mobile phase sodium chloride concentration of 100 mmol/L was
            chromatograms obtained using a 100 mmol/L phosphate buffer (pH   chosen for this mAb analytical method.
            7.0) containing between 50 and 250 mmol/L of sodium chloride.
                                                               3-3.  Impact of Flow Rate
            Fig. 4 shows the relation between sodium chloride concentration   It’s known that the flow rate should be optimized based on
            in the mobile phase and the peak symmetry factor and resolution.   mobile phase composition, packing material particle size, phys-
                                                                                                            2
            At 0 mmol/L sodium chloride in the mobile phase (Fig. 2), electro-  ical and chemical properties of molecules, and other factors .
            static interaction between the column packing material and mAb   Fig. 5 and Fig. 6 show the impact of mobile phase flow rate on
            caused tailing of the monomer peak; but the symmetry factor of   separation for this analysis.


                      mAU
                                                                         Symmetry factor  Aggregates/Monomer
                    75                 2   1. Aggregates           1.5                                 2.0
                    50                     2. Monomer
                                           3. Fragments            1.2                                 1.6
                    25
                     0                                           Symmetry Factor  0.9                  1.2  Resolution
                      0.0  2.5   5.0   7.5  10.0  12.5  min
                      mAU                                          0.6                                 0.8
                                            2
             NaCl   2.5        1                   3               0.3                                 0.4
             0 mmol/L
                                                                   0.0                                 0.0
                                                                        0    50   100   150  200   250
                    0.0
                         5.5  6.0  6.5  7.0  7.5  8.0  8.5  min           Sodium Chloride Concentration (mmol/L)
                                                               Fig. 4. Relationship between Chromatographic Performance and Sodium
            Fig. 2. Chromatograms without Sodium Chloride in Mobile Phase
                                                               Chloride Concentration
                       mAU                                                 mAU                      1. Aggregates
                                1            2                                                  2   2. Monomer
                      2.5                                                                  1     3
              50 mmol/L                             3           0.10 mL/min  2.5                    3. Fragments
                                                                         0.0
                      0.0                                                                2
                                1            2                           2.5         1     3
                      2.5                                       0.15 mL/min
             100 mmol/L                             3                    0.0
                                                                                      2
                      0.0                                                          1    3
                                1            2                  0.20 mL/min  2.5
                      2.5
             150 mmol/L                             3                    0.0
                                                                                    2
                                                                                 1   3
                      0.0                                                2.5
                                                                0.25 mL/min
                                1             2
                      2.5                                                0.0
             200 mmol/L                             3                             2  3
                      0.0                                       0.30 mL/min  2.5  1
                                 1            2                          0.0
                      2.5
             250 mmol/L                             3                          1  2  3
                                                                0.35 mL/min  2.5
                      0.0
                          5.5  6.0  6.5  7.0  7.5  8.0  8.5  min         0.0
            Fig. 3. Chromatograms with Sodium Chloride in Mobile Phase        1  2  3
                                                                0.40 mL/min  2.5
                                                                         0.0
                                                                           0.0   5.0   10.0   15.0  20.0  min
                                                               Fig. 5. Chromatograms and Flow Rate


                                                                                                Shimadzu Journal  vol.9  Issue2 48
   10   11   12   13   14   15   16   17   18   19   20