
Page 22 - Shimadzu Journal vol.8 Issue2
P. 22
Hydrocarbon Processing Industry
There are three primary variables that
determine the elemental selectivity and
sensitivity of an EDXRF instrument when
analyzing liquid samples such as fuels and
oils: analytical measurement time, use
of special X-ray filters, and modification
of the atmosphere within the analytical
chamber. All of these variables can affect
the ability to detect low concentrations of
sulfur within a sample.
Analysis Time
Often, detection limits will decrease with
an increase in analytical integration time.
By increasing the time during which the
sample is irradiated, the detector has
more time to average the signal from the
element of interest thereby increasing
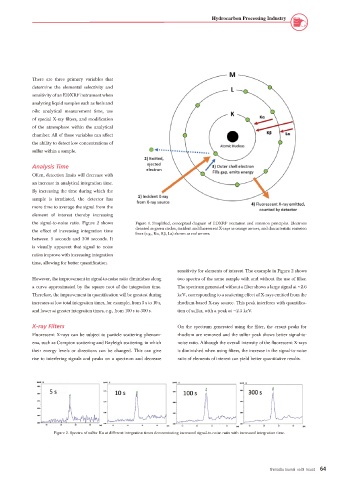
the signal-to-noise ratio. Figure 2 shows Figure 1. Simplified, conceptual diagram of EDXRF excitation and emission principles. Electrons
denoted as green circles, incident and fluorescent X-rays as orange arrows, and characteristic emission
the effect of increasing integration time
lines (e.g., Kα, Kβ, Lα) shown as red arrows.
between 5 seconds and 300 seconds. It
is visually apparent that signal to noise
ratios improve with increasing integration
time, allowing for better quantification.
sensitivity for elements of interest. The example in Figure 2 shows
However, the improvement in signal-to-noise ratio diminishes along two spectra of the same sample with and without the use of filter.
a curve approximated by the square root of the integration time. The spectrum generated without a filter shows a large signal at ~2.6
Therefore, the improvement in quantification will be greatest during keV, corresponding to a scattering effect of X-rays emitted from the
increases at low total integration times, for example, from 5 s to 10 s, rhodium-based X-ray source. This peak interferes with quantifica-
and lower at greater integration times, e.g., from 100 s to 300 s. tion of sulfur, with a peak at ~2.3 keV.
X-ray Filters On the spectrum generated using the filter, the errant peaks for
Fluorescent X-rays can be subject to particle scattering phenom- rhodium are removed and the sulfur peak shows better signal-to-
ena, such as Compton scattering and Rayleigh scattering, in which noise ratio. Although the overall intensity of the fluorescent X-rays
their energy levels or directions can be changed. This can give is diminished when using filters, the increase in the signal-to-noise
rise to interfering signals and peaks on a spectrum and decrease ratio of elements of interest can yield better quantitative results.
Figure 2. Spectra of sulfur Kα at different integration times demonstrating increased signal-to-noise ratio with increased integration time.
64
Shimadzu Journal vol.8 Issue2 64