
Page 22 - Shimadzu Journal vol.7 Issue1
P. 22
Environmental Analysis
To calculate 24 congeners’ relative concentration, Tomy et al. (1997)
presented a method by using the SIM signals of selected quantitative
ions . This method is based on the assumption that the adjusted ion
[8]
signals are proportional to the chlorine atom number in a parent
molecule, as well as its molar concentration. The adjusted ion signals
were calculated from the integrated peak volumes of the quantitative
ions divided by the fractional abundance of the quantitative ions.
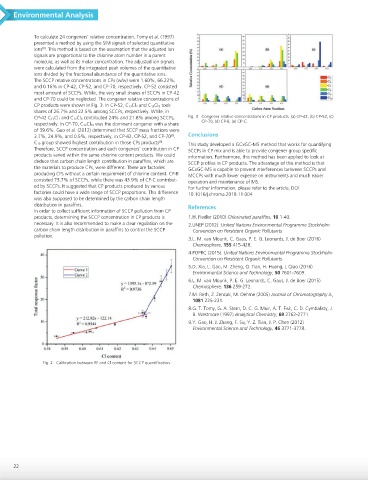
The SCCP relative concentrations in CPs (w/w) were 1.60%, 66.22%,
and 0.16% in CP-42, CP-52, and CP-70, respectively. CP-52 consisted
most amount of SCCPs. While, the very small shares of SCCPs in CP-42
and CP-70 could be neglected. The congener relative concentrations of
CP products were shown in Fig. 3. In CP-52, C13Cl7 and C13Cl8 took
shares of 26.7% and 22.5% among SCCPs, respectively. While, in
CP-42 C13Cl7 and C13Cl8 contributed 24% and 21.8% among SCCPs, Fig. 3 Congener relative concentrations in CP products. (a) CP-42, (b) CP-52, (c)
respectively. In CP-70, C12Cl10 was the dominant congener with a share CP-70, (d) CP-B, (e) CP-C.
of 39.6%. Gao et al. (2012) determined that SCCP mass fractions were
3.7%, 24.9%, and 0.5%, respectively, in CP-42, CP-52, and CP-70 . Conclusions
[9]
[9]
C10 group showed highest contribution in those CPs products . This study developed a GCxGC-MS method that works for quantifying
Therefore, SCCP concentration and each congeners’ contribution in CP SCCPs in CP mix and is able to provide congener group specific
products varied within the same chlorine content products. We could information. Furthermore, this method has been applied to look at
deduce that carbon chain length contribution in paraffins, which are SCCP profiles in CP products. The advantage of this method is that
the materials to produce CPs, were different. There are factories GCxGC-MS is capable to prevent interferences between SCCPs and
producing CPs without a certain requirement of chlorine content. CP-B MCCPs with much lower expense on instruments and much easier
consisted 73.7% of SCCPs, while there was 43.9% of CP-C contribut- operation and maintenance of MS.
ed by SCCPs. It suggested that CP products produced by various For further information, please refer to the article, DOI:
factories could have a wide range of SCCP proportions. This difference 10.1016/j.chroma.2018.11.004
was also supposed to be determined by the carbon chain length
distribution in paraffins. References
In order to collect sufficient information of SCCP pollution from CP
products, determining the SCCP concentration in CP products is 1.H. Fiedler (2010) Chlorinated paraffins, 10 1-40.
necessary. It is also recommended to make a clear regulation on the 2.UNEP (2012). United Nations Environmental Programme Stockholm
carbon chain length distribution in paraffins to control the SCCP Convention on Persistent Organic Pollutants.
pollution.
3.L. M. van Mourik, C. Gaus, P. E. G. Leonards, J. de Boer (2016)
Chemosphere, 155 415-428.
4.POPRC (2015). United Nations Environmental Programme Stockholm
Convention on Persistent Organic Pollutants.
5.D. Xia, L. Gao, M. Zheng, Q. Tian, H. Huang, L Qiao (2016)
Environmental Science and Technology, 50 7601-7609.
6.L. M. van Mourik, P. E. G. Leonards, C. Gaus, J. de Boer (2015)
Chemosphere, 136 259-272.
7.M. Reth, Z. Zencak, M. Oehme (2005) Journal of Chromatography A,
1081 225-231.
8.G. T. Tomy, G. A. Stern, D. C. G. Muir, A. T. Fisk, C. D. Cymbalisty, J.
B. Westmore (1997) Analytical Chemistry, 69 2762-2771.
9.Y. Gao, H. J. Zhang, F. Su, Y. Z. Tian, J. P. Chen (2012)
Environmental Science and Technology, 46 3771-3778.
Fig. 2 Calibration between RF and Cl content for SCCP quantification.
22