Page 18 - Shimadzu Journal vol.2 Issue1
P. 18

Technical Report Technical Report


                                                                                                                                      2. Examples of i-DReC Applications                        mAU                    554 nm
                New Data Processing Method for Photodiode                                                                                                                                        300
                                                                                                                                      2-1. Extending the Linear Dynamic
                Array Detector                                                                                                               Range of Calibration Curves                         200
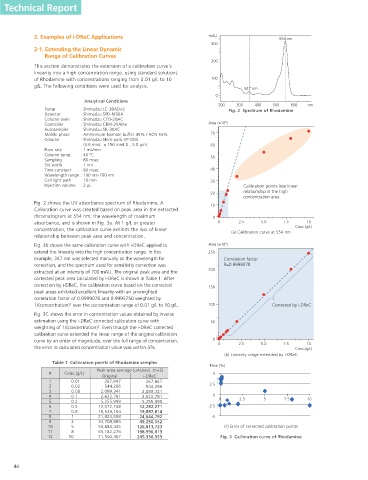
                                                                                                                                      This section demonstrates the extension of a calibration curve's
                                                                                                                                      linearity into a high concentration range, using standard solutions
            1SJODJQMF BOE 4VNNBSZ PG J %3F$  *OUFMMJHFOU %ZOBNJD 3BOHF &YUFOTJPO $BMDVMBUPS                                           of Rhodamine with concentrations ranging from 0.01 g/L to 10   100
                                                                                                                                      g/L. The following conditions were used for analysis.
            Toshinobu Yanagisawa 1                                                                                                                                                                          347 nm
                                                                                                                                                                                                  0
                                                                                                                                                       Analytical Conditions
                                                                                                                                                                                                   200   300   400   500   600   nm
            Abstract                                                                                                                      Pump        : Shimadzu LC-30AD×2                             Fig. 2  Spectrum of Rhodamine
                                                                                                                                                      : Shimadzu SPD-M30A
                                                                                                                                          Detector
                                                                                                                                          Column oven  : Shimadzu CTO-20AC
            A new data processing method for a photo diode array (PDA) detector, Intelligent Dynamic Range Extension Calculator (i-DReC) enables   Controller  : Shimadzu CBM-20Alite           Area (×10 ) 6
            the  automatic calculation of  peak  area  and height,  utilizing  spectrum  similarity  in the high  concentration  range  where UV signal  is   Autosampler  : Shimadzu SIL-30AC
            saturated.  When  the  integrated  chromatographic  peak  area  exceeds  a  user-defined  threshold  value,  i-DReC  automatically  shifts  the   Mobile phase  : Ammonium formate buffer 45% / ACN 55%  70
            chromatographic profile to a wavelength with less UV absorption to prevent signal saturation. The absorption ratio between the original   Column  : Shimadzu Shim-pack VP-ODS
            target wavelength and the wavelength used by the i-DReC function is applied as a correction factor to the peak area of the acquired         (4.6 mmL. × 150 mmI.D., 5.0 µm)          60
            chromatogram, thereby calculating the peak area and height at the original target wavelength. The i-DReC dramatically extends the linear   Flow rate  : 1 mL/min
                                                                                                                                          Column temp.
                                                                                                                                                      : 40 °C
            dynamic range of calibration curves, enabling reliable quantitation of high concentration samples without need for sample dilution and   Sampling  : 80 msec                         50
            reinjection, which would otherwise be required.                                                                               Slit width  : 1 nm
                                                                                                                                          Time constant  : 80 msec                               40
            Keywords:PDA data processing, dynamic range extension, Nexera X2, UHPLC                                                       Wavelength range  : 190 nm-700 nm
                                                                                                                                          Cell light path  : 10 mm                               30
                                                                                                                                          Injection volume  : 2 µL                                          Calibration points lose linear
                                                                                                                                                                                                            relationship in the high
                                                                                                                                                                                                 20
            1. Basic Principle of i-DReC                       5. An absorption ratio (k) is calculated from the spectrum in (4).                                                                           concentration area.
                                                                 The intensity (Ia) of the spectrum at λa is divided by the intensity   Fig. 2 shows the UV absorbance spectrum of Rhodamine, A   10
            High concentration samples can produce saturated UV spectral                                                              Calibration curve was created based on peak area in the extracted
            absorbance, which significantly affects peak area calculation and   (Ib) of the spectrum at λb, as follows:               chromatogram at 554 nm, the wavelength of maximum          0
            causes a loss of linearity in the relationship of peak area to   k=Ia/Ib                                                  absorbance, and is shown in Fig. 3a. At 1 g/L or greater     0      2.5    5.0     7.5    10
            concentration. The i-DReC calculates an absorbance ratio between   6. Peak area and height of the measured peak in the    concentration, the calibration curve exhibits the loss of linear                       Conc.(g/L)
            the original target wavelength and another wavelength that   chromatogram at λb are corrected by the absorption ratio to   relationship between peak area and concentration.                (a) Calibration curve at 554 nm
            provides less absorbance in a spectrum on the down-slope of the   determine the effective area and height at λa, as follows:                                                        Area (×10 ) 6
            chromatographic peak where neither wavelength's absorbance is   Peak area at λa = (peak area at λb) × k                   Fig. 3b shows the same calibration curve with i-DReC applied to
            saturated. The corrected peak area and height are then calculated   Peak height at λa = (peak height at λb) × k           extend the linearity into the high concentration range. In this   250
            by multiplying the measured peak area and height by the                                                                   example, 347 nm was selected manually as the wavelength for    Correlation factor
            absorbance ratio.                                                                                                         correction, and the spectrum used for sensitivity correction was   200  R=0.9999078
                                                                                       Extraction of chromatogram at λb               extracted at an intensity of 700 mAU. The original peak area and the
                                                                    mAU
              Calculation Algorithm                                4000 λa nm                                                         corrected peak area calculated by i-DReC is shown in Table 1. After
                                                                                                                                      correction by i-DReC, the calibration curve based on the corrected
            1. i-DRec is automatically applied when the intensity of a target                                                                                                                   150
              peak exceeds the user-defined threshold value. If the threshold                                                         peak areas exhibited excellent linearity with an unweighted
              value is not exceeded, i-DReC is not applied.             Threshold                                                     correlation factor of 0.9999078 and 0.9995750 weighted by   100
                                                                        level
                                                                                                                                                  2
                                                                                                     λb nm                            1/(concentration)  over the concentration range of 0.01 g/L to 10 g/L.         Corrected by i-DReC
            2. The wavelength used for correction by i-DReC (λb) can be set
              either manually or automatically. When set manually, λb is a   0                                                        Fig. 3C shows the error in concentration values obtained by inverse
              user-defined parameter. When set automatically, λb is                                                                   estimation using the i-DReC corrected calibration curve with   50
                                                                                                                                                           2
              determined as follows:                                               Extraction of                                      weighting of 1/(concentration) . Even though the i-DReC corrected
                                                                                   spectrum for                                       calibration curve extended the linear range of the original calibration
                A UV spectrum is acquired at the retention time of the target peak.  sensitivity correction                           curve by an order of magnitude, over the full range of concentration,   0
                                                                    mAU                                                                                                                            0      2.5    5.0     7.5    10
                The spectrum is analyzed to determine an appropriate wavelength   Signal intensity for   Absorption ratio             the error in calculated concentration value was within 5%.                             Conc.(g/L)
                                                                        extraction of sensitivity
                for which the absorbance is not saturated, which is then set as λb.  correction spectrum  is calculated by Ia                                                                        (b) Linearity range extended by i-DReC
                                                                                             and Ib
            3. The chromatogram at λb is extracted from the 3D data and                            Ia                                       Table 1  Calibration points of Rhodamine samples    Error (%)
                                                                                  correction
              integrated to determine peak area and height.                 Ia      Sensitivity   k =  Ib                                  #    Conc.(g/L)  Peak area average (uAUsec)  (n=2)    5
            4. A UV spectrum is extracted from the chromatogram (at the         spectrum                                                   1        0.01     Original     i-DReC
                                                                                                                                                              267,847
                                                                                                                                                                           267,847
              original target wavelength (λa)) at a point on the down-slope of                                                             2        0.02      544,266      544,266              2.5
              the peak (between the peak apex and peak end) where the                  λa                                                  3 4      0.08    2,089,341     2,089,341              0
                                                                                                                                                            2,622,781
                                                                                                                                                    0.1
                                                                                                                                                                          2,622,781
              absorbance of neither λa nor λb are saturated.                                                                               5        0.2     5,255,999     5,255,999                0      2.5     5      7.5     10
                                                                            Ib     λb                                                      6        0.5    12,072,748    12,282,271             -2.5
                                                                                                                                           7        0.8    18,539,104    19,887,814
                                                                              λ                                                            8        1      21,823,608    24,644,792              -5
                                                                           Fig. 1  Basic principle of i-DReC                               9        2      33,708,885    49,250,552
                                                                                                                                           10       5      53,883,445   126,813,723                  (c) Error of corrected calibration points
                                                                                                                                           11       8      65,182,276   198,990,013
                                                                                                                                           12     10       71,500,307   245,336,353                 Fig. 3  Calibration curve of Rhodamine
            1. Analytical & Measuring Instruments Division
                                                                                                                     43        44
   13   14   15   16   17   18   19   20   21   22   23