Page 20 - Shimadzu Journal vol.2 Issue1
P. 20

Technical Report Technical Report


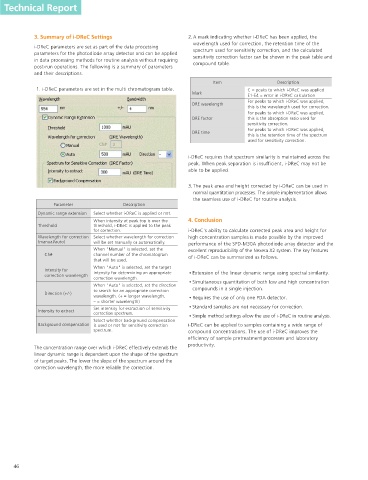
            2-2. Simultaneous Quantitation of Main                   Area (×10 ) 6                                                    3. Summary of i-DReC Settings                      2. A mark indicating whether i-DReC has been applied, the
                   Component and Minor Impurities                                                                                                                                          wavelength used for correction, the retention time of the
                                                                      30  Correlation factor                                          i-DReC parameters are set as part of the data processing   spectrum used for sensitivity correction, and the calculated
            This section demonstrates the use of i-DReC to simultaneously   R=0.9996726                                               parameters for the photodiode array detector and can be applied   sensitivity correction factor can be shown in the peak table and
            quantify a relatively high concentration major component in a   25                                                        in data processing methods for routine analysis without requiring   compound table.
            pharmaceutical sample and the relatively low concentration impurities.                                                    post-run operations. The following is a summary of parameters
            Samples in which the concentration of the main component ranged   20                                                      and their descriptions.
            from 0.01 g/L to 1 g/L where analyzed using the SPD-M30A                        Correction                                                                                            Item                 Description
                                                                                            by i-DReC
            photodiode array detector equipped with the high sensitivity cell. Fig.   15                                               1. i-DReC parameters are set in the multi chromatogram table.         C = peaks to which i-DReC was applied
            4 shows the calibration curve for the main component based on peak                                                                                                             Mark              E1-E4 = error in i-DReC calculation
            area in the extracted chromatogram at 250 nm.                                                                                                                                                    For peaks to which i-DReC was applied,
                                                                      10                                                                                                                   DRE wavelength
                                                                                          Original                                                                                                           this is the wavelength used for correction.
                             Analytical Conditions                    5                                                                                                                                      For peaks to which i-DReC was applied,
               Pump        : Shimadzu LC-30AD×2                                                                                                                                            DRE factor        this is the absorption ratio used for
                                                                                                                                                                                                             sensitivity correction.
               Detection   : Shimadzu SPD-M30A
               Column oven  : Shimadzu CTO-20AC                       0                                                                                                                    DRE time          For peaks to which i-DReC was applied,
               Controller  : Shimadzu CBM-20Alite                        0    0.25    0.5    0.75     1                                                                                                      this is the retention time of the spectrum
               Autosampler  : Shimadzu SIL-30AC                                                    Conc. (g/L)                                                                                               used for sensitivity correction.
               Column      : Shimadzu Shim-pack XR-ODS                   (a) Calibration curve of the main component
                             (150 mmL. × 3.0 mmI.D., 2.2 µm)
               Mobile phase A  : 5% MeCN + 0.05% TFA                                                                                                                                     i-DReC requires that spectrum similarity is maintained across the
               Mobile phase B  : 95% MeCN + 0.05% TFA                                                                                                                                    peak. When peak separation is insufficient, i-DReC may not be
               Time program  : 2% (0–1.2 min)     2–98% (1.2–8.9 min)   Error (%)
                             98% (8.9–10.8 min)     98–2% (10.8–11.1 min)  4                                                                                                             able to be applied.
                                 STOP (14 min)
               Flow rate   : 1 mL/min                                  2
               Column temp.  : 40 °C                                                                                                                                                     3. The peak area and height corrected by i-DReC can be used in
               Sampling    : 160 msec                                                                                                                                                      normal quantitation processes. The simple implementation allows
               Slit width  : 8 nm                                      0  0    0.25    0.5    0.75    1                                                                                    the seamless use of i-DReC for routine analysis.
               Time constant  : 160 msec                                                                                                     Parameter              Description
               Wavelength range  : 190 nm-700 nm                      -2
               Cell light path  : 85 mm                                                                                                 Dynamic range extension  Select whether i-DReC is applied or not.
               Injection volume  : 1 µL                               -4                                                                                  When intensity at peak top is over the   4. Conclusion
                                                                                                                                        Threshold         threshold, i-DReC is applied to the peak
                                                                           (b) Error of corrected calibration points                                      for correction.                i-DReC's ability to calculate corrected peak area and height for
            As shown in Fig. 4a, calibration points for concentrations above   Fig. 4  Linearity evaluation                             Wavelength for correction  Select whether wavelength for correction   high concentration samples is made possible by the improved
            0.5 g/L deviate from linear relationship. In this example, 280 nm                                                           (manual/auto)     will be set manually or automatically.  performance of the SPD-M30A photodiode array detector and the
            was selected manually as the wavelength for correction, and the                                                                               When "Manual" is selected, set the  excellent reproducibility of the Nexera X2 system. The key features
            spectrum used for sensitivity correction was extracted at an   mAU                                                            Ch#             channel number of the chromatogram  of i-DReC can be summarized as follows.
            intensity of 200 mAU. The absorption ratio was calculated and   100                    250 nm, 4 nm                                           that will be used.
            used to correct the peak areas and extend the linear dynamic                                                                  Intensity for   When "Auto" is selected, set the target
            range of the calibration curve, resulting in a correlation factor R of           Main                                         correction wavelength  intensity for determining an appropriate     Extension of the linear dynamic range using spectral similarity.
                                                                                                                                                          correction wavelength.
            0.9996726 weighted by 1/(concentration)  over the concentration   75                                                                          When "Auto" is selected, set the direction     Simultaneous quantitation of both low and high concentration
                                          2
            range of 0.01 g/L to 1 g/L.                                                                                                   Direction (+/-)  to search for an appropriate correction     compounds in a single injection.
            Fig. 4b shows the error in concentration values obtained by   50          Imp3                                                                wavelength. (+ = longer wavelength,     Requires the use of only one PDA detector.
            inverse estimation using the i-DReC corrected calibration curve        Imp2                                                                   – = shorter wavelength)           Standard samples are not necessary for correction.
                                      2
            with weighting of 1/(concentration)  is within 4%. The   25                                                                 Intensity to extract  Set intensity for extraction of sensitivity
                                                                                                                                                          correction spectrum.
            reproducibility of the peak area (n=6) of the main component and   Imp1                                                                       Select whether background compensation      Simple method settings allow the use of i-DReC in routine analysis.
            impurities, as well as the peak area ratio between the main   0                                                             Background compensation is used or not for sensitivity correction   i-DReC can be applied to samples containing a wide range of
            component and impurities, is shown in Table 2. An example                                                                                     spectrum.                      compound concentrations. The use of i-DReC improves the
                                                                                                          6.0
            chromatogram for the sample is shown in Fig. 5. In this example,   3.5  4.0  4.5  5.0  5.5    min                                                                            efficiency of sample pretreatment processes and laboratory
            i-DReC was only applied to correct the peak area of the main                                                              The concentration range over which i-DReC effectively extends the   productivity.
            component, which provided a saturated signal at 250 nm.  mAU
                                                                    20                                                                linear dynamic range is dependent upon the shape of the spectrum
                                                                                                              Main                    of target peaks. The lower the slope of the spectrum around the
             Table 2  Peak area reproducibility of the pharmaceutical sample                                                          correction wavelength, the more reliable the correction.
                       Retention   Mean Area  Area  Area            10    Imp1            Imp2  Imp3
                Peak   Time(min)  (µAUsec)  %RSD  Ratio(%)
                        4.634   31,123,746  0.06    --
                        5.448    925,522  0.12     2.974              4.0  4.1   4.2  4.3   4.4   4.5  4.6
                        3.900     64,161  0.08     0.206                                                 min
                        4.910     32,810  0.15     0.105
                        5.091     15,103  0.16     0.049            Fig. 5  Chromatogram of the pharmaceutical sample
                        4.487      9,487  0.26     0.030
                        4.226      7,981  0.28     0.026       As shown in Table 2, i-DReC correction provided peak area repro-
                        4.975      7,981  0.44     0.026
                        4.056      2,001  0.27     0.006       ducibility of 0.06% RSD for peak 1, the main component. Peak area
                        4.331      2,440  0.85     0.008       reproducibility for impurity peak 3 (Imp3), whose peak area was
                        4.376      1,663  0.65     0.005       0.005% of the main component, was less than 1%.


                                                                                                                     45        46
   15   16   17   18   19   20   21   22   23   24   25