Page 16 - Shimadzu Journal vol.2 Issue1
P. 16

Technical Report            Technical Report


            2-2. Quantitation of a Mixture of                   Absorbance  Normalized                                                3. Summary of i-PDeA Settings                      4. Conclusion
                   Two Components                                       Spectrum of VP   255.93 nm                                    The parameters for the i-PDeA function are set as part of the data   The excellent performance and reproducibility of the SPD-M30A
                                                                                              Spectrum of DFBP
            This section demonstrates that the derivative spectrum chromatogram                                                       processing method of the photodiode array detector. Once the   photodiode array detector and the Nexera X2 system make this
            method can separate and quantitate two chromatographically co-eluted                                                      analytical protocol is defined, it can be applied for routine   new separation methodology possible. The i-PDeA function
            peaks in a data set acquired for a mixture of two components.                                                             analysis. The following is a brief summary of the i-PDeA   helps increase the speed of analysis and enhances laboratory
                                                                                                                                      parameters.                                        productivity. To summarize the key benefits:
            Difluorobenzophenone (DFBP) and Valerophenone (VP) standards,
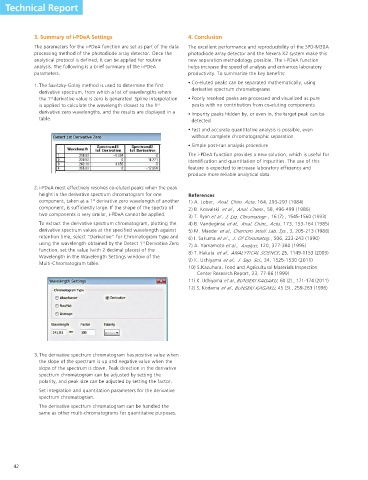
            in 5 different relative concentrations of 100/1,100/10,100/50,                                                            1.  The Savitzky-Golay method is used to determine the first   Co-eluted peaks can be separated mathematically, using
            100/100,100/200, were used to acquire the derivative spectrum                                                               derivative spectrum, from which a list of wavelengths where   derivative spectrum chromatograms
            chromatograms of DFBP and VP. A calibration curve was created   216.93 nm                                                       st
                                                                      0                                                                 the 1 derivative value is zero is generated. Spline interpolation   Poorly resolved peaks are processed and visualized as pure
            (Table 1) and quantitative analysis of each sample mixture was                                                              is applied to calculate the wavelength closest to the 1    peaks with no contribution from co-eluting components
                                                                                                                                                                               st
            performed (Tables 2 and 3).                                     225.0    250.0     275.0    nm                              derivative zero wavelengths, and the results are displayed in a
                                                                         Fig. 4  Spectrum comparison; DFBP and VP                                                                         Impurity peaks hidden by, or even in, the target peak can be
                                                                                                                                        table.                                            detected
                             Analytical Conditions               Table 1  Calibration data points created by derivative spectrum
                    Pump        : Shimadzu LC-30AD×2                         chromatogram of VP standard sample (R =0.9999309)                                                            Fast and accurate quantitative analysis is possible, even
                                                                                                    2
                    Detector    : Shimadzu SPD-M30A                                                                                                                                       without complete chromatographic separation
                    Column oven  : Shimadzu CTO-20AC              Sample relative  Retention
                    Controller  : Shimadzu CBM-20A                concentration  time   Area  Concentration  Error (%)                                                                    Simple post-run analysis procedure
                    Autosampler  : SIL-30ACMP                        (VP)      (min)                                                                                                     The i-PDeA function provides a new solution, which is useful for
                    Mobile phase  : Acetonitrile45% / Water55%
                    Column      : Shimadzu Shim-pack XR-C8           1        1.804      2,984   0.964   -3.62                                                                           identification and quantitation of impurities. The use of this
                                  (50 mmL. × 3.0 mmI.D., 2.2 µm)                                                                                                                         feature is expected to increase laboratory efficiency and
                    Flow rate   : 2 mL/min                           10       1.801     30,368   9.876   -1.24                                                                           produce more reliable analytical data.
                    Column temp.  : 40 °C
                    Sampling    : 80 msec                            50       1.804    151,922  49.439   -1.12
                    Slit width  : 1 nm                               100      1.802    310,801  101.149   1.15                        2.  i-PDeA most effectively resolves co-eluted peaks when the peak
                    Time constant  : 240 msec                                                                                           height in the derivative spectrum chromatogram for one   References
                    Wavelength range  : 190 nm to 700 nm             200      1.802    613,207  199.572  -0.21                                            st
                                                                                                                                                                                                   Anal. Chim. Acta
                    Injection volume  : 1 µL                                                                                            component, taken at a 1  derivative zero wavelength of another   1) A. Lober,                           , 164, 293-297 (1984)
                                                                                                                                        component, is sufficiently large. If the shape of the spectra of   2) B. Kowalski        .,                   ., 58, 496-499 (1986)
                                                                                                                                                                                                    et al
                                                                                                                                                                                                         Anal. Chem
                                                                   Table 2  Quantitation result of VP in DFBP/VP mixed sample
                                                                                                                                        two components is very similar, i-PDeA cannot be applied.  3) T. Ryan        .,                               ., 16 (7) , 1545-1560 (1993)
                                                                                                                                                                                                 et al
                                                                                                                                                                                                      J. Liq. Chromatogr
            Fig. 4  shows the spectrum comparison of DFBP and VP. Fig. 5 shows   Sample relative  Retention                             To extract the derivative spectrum chromatogram, plotting the   4) B. Vandeginse       .,                            , 173, 153-164 (1985)
                                                                                                                                                                                                      et al
            the absorbance chromatogram of the mixed sample (DFBP/VP=  concentration  time  Area  Concentration  Error (%)              derivative spectrum values at the specified wavelength against     Anal. Chim., Acta
                                                                                                                                                                                                    et al Chemom. Intell. Lab. Sys
            100/200) at 210 nm and the derived spectrum chromatogram at   (DFBP/VP)  (min)                                              retention time, select “Derivative” for Chromatogram Type and   5) M. Maeder       .,                                     ., 3, 205-213 (1988)
                                                                                                                                                                                                   et al
                                                                                                                                                                                                        J. Of Chromatog
                                                            st
                      st
            255.93 nm (1  derived zero wavelength of DFBP) & 216.93 nm (1    100/1  1.808  3,167  1.023   2.30                          using the wavelength obtained by the Detect 1  Derivative Zero   6) I. Sakuma        .,                          ., 506, 223-243 (1990)
                                                                                                                                                                          st
                                                                                                                                                                                                           Analyst
                                                                                                                                                                                                      et al
            derived zero wavelength of VP).                                                                                                                                              7) A. Yamamoto       .,             , 120, 377-380 (1995)
                                                                   100/10     1.807     30,372   9.878   -1.22                          function, set the value (with 2 decimal places) of the   8) T. Hakuta         .,                                                                        , 25, 1149-1153 (2009)
                                                                                                                                                                                                   et al ANALYTICAL SCIENCE
            Fig. 6 shows the absorbance chromatogram of the mixed sample   100/50  1.802  153,206  49.856  -0.29                        Wavelength in the Wavelength Settings window of the
                                                                                                                                                                                                     et al
                                                                                                                                                                                                          J. Sep. Sci
            (DFBP/VP=100/1) at 210 nm. Due to the low concentration in the                                                              Multi-Chromatogram table.                        9) K. Uchiyama        .,                ., 34, 1525-1530 (2011)
            sample, the VP peak is hidden in the DFBP peak. The ellipse in Fig.   100/100  1.806  309,596  100.757  0.76                                                                 10) S.Kazuhara, Food and Agricultural Materials Inspection
            6 shows the derivative spectrum chromatograms, which are used   100/200  1.815  620,556  201.964  0.98                                                                             Center Research Report, 23, 77-86 (1999)
                                                                                                                                                                                                     et al BUNSEKI KAGAKU
            by i-PDeA to find and integrate the peak.                                                                                                                                    11) K. Uchiyama        .,                               , 60 (2) , 171-174 (2011)
                                                                                                                                                                                         12) S. Kodama        .,                              , 45 (3) , 259-263 (1996)
                                                                                                                                                                                                    et al BUNSEKI KAGAKU
            The VP calibration curve, created by using the integrated peak   Table 3  Quantitation result of DFBP in DFBP/VP mixed sample
            area for VP in the derivative spectrum chromatogram, was used to   Sample relative  Retention
            calculate the quantitative amount of VP in each sample. The   concentration  time  Area  Concentration  Error (%)
            results are shown in Table 2. In the case of the lowest VP   (DFBP/VP)  (min)
            concentration sample (DFBP/VP = 100/1), the concentration was   100/1  1.746  359,670  102.225  2.23
            calculated to be 1.023 (2.30% error).
                                                                   100/10     1.742    357,969  101.741   1.74
            In the same way, the DFBP calibration curve was created and used   100/50  1.737  357,497  101.607  1.61
            to calculate the quantitative amount of DFBP in each sample.  The
            results are shown in Table 3. Of note in these results is the   100/100  1.742  357,891  101.719  1.72
            reproducibility of peak area for a 1 µL sample injection (<1% RSD)   100/200  1.751  351,528  99.911  -0.09               3.  The derivative spectrum chromatogram has positive value when
            as well as <3% error in the quantitative calculation.                                                                       the slope of the spectrum is up and negative value when the
                                                                          Area %RSD=0.87 (injection volume:1 µL)                        slope of the spectrum is down. Peak direction in the derivative
                        mAU                                               mAU                                                           spectrum chromatogram can be adjusted by setting the
                     200  Ch1-210 nm, 4 nm  VP                          125  210 nm, 4 nm                                               polarity, and peak size can be adjusted by setting the factor.
                        Ch2-Derivative 255.93 nm                                        Absorbance chromatogram
                        Ch3-Derivative 216.93 nm  Absorbance            100
                     150                   chromatogram                                                                                 Set integration and quantitation parameters for the derivative
                                   DFBP                                 75                                                              spectrum chromatogram.
                         Derivative spectrum
                     100
                         chromatogram                                                                                                   The derivative spectrum chromatogram can be handled the
                         at 255.93 nm      Derivative spectrum          50                                                              same as other multi-chromatograms for quantitative purposes.
                      50                   chromatogram
                                           at 216.93 nm                 25
                       0
                                                                         0
                      1.60  1.65  1.70  1.75  1.80  1.85  1.90  1.95  min  1.60  1.65  1.70  1.75  1.80  1.85  1.90  1.95  min
              Fig. 5  Peak separation in the mixed sample (DFBP/VP=100/200)  Fig. 6  Absorbance chromatogram of the mixed sample (DFBP/VP=100/1)
                                                                                                                     41        42
   11   12   13   14   15   16   17   18   19   20   21