Page 13 - Shimadzu Journal vol.2 Issue1
P. 13

Technical Report            Technical Report


                                                                                                                                      As sx‘(λy) and sy’(λx) are non-zero constants in equations (1) and   Fig. 3 shows the absorbance chromatogram at 235 nm and
                Fractional Determination of Co-eluted Compounds Using                                                                 (2), it can be seen that the derivative spectrum chromatogram at   derived spectrum chromatogram at 1  derivative zero wavelength
                                                                                                                                                                                                                    st
                                                                                                                                      wavelength λx shows the elution profile for component y only, and   under several types of analytical conditions.
                a New Data Processing Method for Photodiode Array Detector                                                            the derivative spectrum chromatogram at wavelength λy shows   In (a), the impurity is detected using i-PDeA, even though MN and
                                                                                                                                      the elution profile for component x only.          its impurity overlap chromatographically.
                                                                                                                                      That is, the derivative spectrum chromatogram at wavelength λx   In (b), MN and the impurity begin to separate
            1SJODJQMF BOE 4VNNBSZ PG J 1%F"  *OUFMMJHFOU 1FBL %FDPOWPMVUJPO "OBMZTJT                                                  can separate component y only, and the derivative spectrum   chromatographically. By comparing the spectra at the apex of
                                                                                                                                      chromatogram at wavelength λy can separate component x only.   each peak, MN and the impurity can be confirmed to be different
            Toshinobu Yanagisawa 1
                                                                                                                                                                                         compounds.
                                                                                                                                      1-2. Impurity Detection                            In (c), MN and the impurity are completely separated
            Abstract                                                                                                                                                                     chromatographically. The derived spectrum chromatogram shows
                                                                                                                                      i-PDeA can detect whether impurity components exist in addition   no significant signal at the retention time of the MN peak, which
            The i-PDeA derivative spectrum chromatogram method was developed as a new data processing technique for photodiode array detectors   to the major component. This method can be applied when one   shows the signal of the MN peak does not include a contribution
            for HPLC. A derivative spectrum is created by performing differential processing on the UV-Vis absorption spectrum at each measurement   major component is mixed with other impurity components. The   from the impurity.
            time. Plotting the derivative spectrum values at the specified wavelength against retention time creates a derivative spectrum   3D chromatogram S (t, λ) can be expressed as follows if the major
            chromatogram that is able to separate co-eluted peaks. The high selectivity of the derivative spectrum chromatogram can detect   component elution profile is denoted as px (t), the impurity   As described in this example, whether impurity peaks are
            unexpected impurities and quantitate the target component only, without effects from interfering components that elute simultaneously.                                       chromatographically resolved or co-eluted with the main
            This paper formulates the theory of the derivative spectrum chromatogram method into mathematical expressions and reports details of   component elution profiles as py (t), pz (t)…, the major component   component, i-PDeA easily detects their existence.
            verification of the basic performance using standard samples.                                                             spectrum as sx (λ), and the impurity spectra as sy (λ), sz (λ)…

            Keywords:PDA data processing, peak deconvolution, derivative spectrum chromatogram, Nexera X2, UHPLC                          S  , (t  ) λ =  p x (t )s x (λ ) +  p y (t )s y  (λ ) +  p z (t )s z  (λ )...  110  mAU
                                                                                                                                                                                              Ch1-235 nm, 4 nm
                                                                                                                                                                                           100 Ch2-Derivative 241.81 nm  Absorbance
                                                                                                                                                                                                                    chromatogram of MN
                                                                                                                                      Then, the derivative spectrum chromatogram at wavelength λx at   90
            1. Basic Theory of the Derivative                                                                                         which the major component derivative spectrum chromatogram   80
                Spectrum Chromatogram Method                                                                                          sx'(λ) value becomes zero is given by                70
                                                                                                                                                                                           60
            1-1. Separation of Two Component                                                                                              ∂S                                               50  Derivative spectrum
                   Co-eluted Peaks                                                                                                        ∂λ    (t ) = p y (t )s y  ( ' λ x ) + p z (t )s z  ( ' λ x  ) + ...  40  chromatogram
                                                                                                                                             λ =λ x                                        30
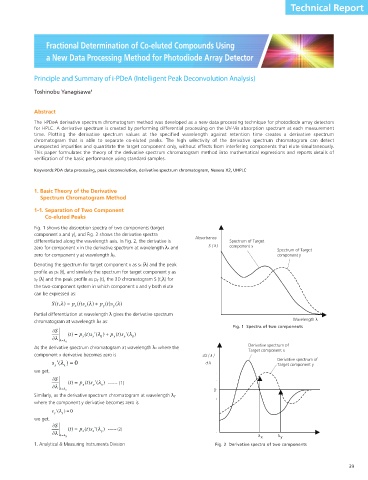
            Fig. 1 shows the absorption spectra of two components (target                                                                                                                  20
            component x and y), and Fig. 2 shows the derivative spectra   Absorbance                                                  Therefore, the derivative spectrum chromatogram at wavelength λx   10
            differentiated along the wavelength axis. In Fig. 2, the derivative is   Spectrum of Target                               eliminates the major component elution profile and expresses the   0
            zero for component x in the derivative spectrum at wavelength λx and   S ( λ )  component x                               elution profiles of the impurities besides the major component.  0.21  0.22  0.23  0.24  0.25  0.26  0.27  min
                                                                                             Spectrum of Target
            zero for component y at wavelength λy.                                           component y                                                                                            (a) Mobile phase : Acetnirile95% / Water5%
                                                                                                                                                                                              mAU
                                                                                                                                                                                           90
            Denoting the spectrum for target component x as sx (λ) and the peak                                                       2. Examples of Analysis Using                           Ch1-235 nm, 4 nm      Absorbance
                                                                                                                                                                                              Ch2-Derivative 241.81 nm
            profile as px (t), and similarly the spectrum for target component y as                                                       the i-PDeA Functions                             80                       chromatogram of MN
            sy (λ) and the peak profile as py (t), the 3D chromatogram S (t,λ) for                                                                                                         70
            the two-component system in which component x and y both elute                                                            2-1. Impurity Detection in                           60                                Impurity
            can be expressed as:                                                                                                             Standard Samples                              50
                                                                                                                                                                                              Derivative spectrum      MN
                                                                                                                                                                                           40
                  S  , (t  ) λ =  p x  t ) ( s x (λ ) +  p y  t ) ( s y (λ )                                                          This section demonstrates that an impurity in a methylnaphthalene   chromatogram
                                                                                                                                      (MN) standard was detected using the derivative spectrum   30                  Spectra of MN and impurity
            Partial differentiation at wavelength λ gives the derivative spectrum                                                     chromatogram method.                                 20
            chromatogram at wavelength λd as:                                                     Wavelength λ                                                                             10
                                                                              Fig. 1  Spectra of two components
                   S ∂  (t ) =  p  (t )s  ( ' λ  ) +  p  (t )s  ( ' λ  )                                                                              Analytical Conditions                 0
                                                                                                                                                                                                                          0.350
                                                                                                                                                                                                                0.325
                                                                                                                                                                                                      0.300
                  ∂ λ  λ =  d λ  x  x  d  y  y  d                                                                                                                                                  (b) Mobile phase : Acetonitrile85% / Water15%  min
            As the derivative spectrum chromatogram at wavelength λx where the     Derivative spectrum of                                    Pump        : Shimadzu LC-30AD×2                 mAU
                                                                                                                                                         : Shimadzu SPD-M30A
                                                                                                                                             Detector
                                                                                   Target component x                                                                                     22.5  Ch1-235 nm, 4 nm
            component x derivative becomes zero is                  dS ( λ )                                                                 Column oven  : Shimadzu CTO-20AC             20.0  Ch2-Derivative 242.14 nm  Absorbance
                                                                                                                                                         : Shimadzu CBM-20A
                                                                                                                                             Controller
                  s x  ( ' λ x ) =  0                                d λ                     Derivative spectrum of                          Autosampler  : Shimadzu SIL-30ACMP           17.5                           chromatogram of MN
                                                                                             Target component y
            we get,                                                                                                                          Column      : Shimadzu Shim-pack XR-ODS      15.0
                                                                                                                                                           (30 mmL. × 3.0 mmI.D., 2.2 µm)
                   S ∂  (t ) =  p  (t )s  ( ' λ  ) ------ (1)                                                                                Flow rate   : 1 mL/min                       12.5
                  ∂ λ  λ =  x λ  y  y  x                                0                                                                    Column temp.  : 40 °C                        10.0      Derivative spectrum
                                                                                                                                                         : 80 msec
                                                                                                                                             Sampling
            Similarly, as the derivative spectrum chromatogram at wavelength λy                                                              Slit width  : 1 nm                            7.5      chromatogram
                                                                                                                                             Time constant  : 240 msec
            where the component y derivative becomes zero is                                                                                 Wavelength range  : 190 nm to 700 nm          5.0
                  s  y  ( ' λ y ) =  0                                                                                                       Injection volume  : 1 µL                      2.5
                                                                                                                                                                                           0.0
            we get,
                   S ∂  (t  p  (t )s                                                                                                                                                             1.6   1.7  1.8   1.9   2.0   2.1    min
                                                                                                                                                                                                    (c) Mobile phase : Acetnitrile50% / Water50%
                  ∂ λ  λ =  y λ  ) =  x  x  ( ' λ y ) ------ (2)                       λ  x   λ  y                                                                                        Fig. 3  Absorbance chromatogram and derivative spectrum chromatogram
            1. Analytical & Measuring Instruments Division              Fig. 2  Derivative spectra of two components
                                                                                                                     39        40
   8   9   10   11   12   13   14   15   16   17   18