
Page 9 - Shimadzu Journal vol.1
P. 9
͠
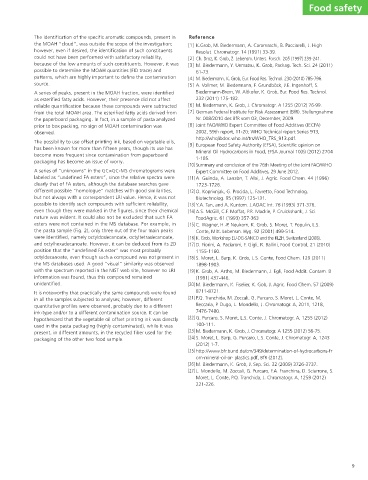
The high scan speed of GCMS-QP2010 Ultra has the potential of increasing the separation power of the second dimension, that promotes
47.77
47.76 47.75
10 Hz (4,000 u/sec) 47.74 47.73
applicability of high sensitive, user friendly and economical quadrupole mass spectrometer to GC×GC-MS analysis.
47.71 47.72
TIC 47.70
4000000 3500000 3000000 2500000 2000000 1500000 1000000 500000
47.77 47.76
25 Hz (10,000 u/sec) 47.75 47.74 47.73
47.71 47.72 ࠓճඞཁແ
The 2-dim chromatogram of fatty acids and scan speed
The 2-dim chromatogram of fatty acids and scan speed
TIC 47.70
5000000 4500000 4000000 3500000 3000000 2500000 2000000 1500000 1000000 500000
44.63 44.62
50 Hz (20,000 u/sec) 44.61 44.60 44.59 44.58
44.56 44.57
44.55
TIC 44.54
7000000 6000000 5000000 4000000 3000000 2000000 1000000
2dim Image
GC×GC
Food safety TIC
Food safety 9
K.Grob, M. Biedermann, A. Caramaschi, B. Pacciarelli, J. High
Resolut. Chromatogr. 14 (1991) 33-39. Ch. Droz, K. Grob, Z. Lebensm. Unters. Forsch. 205 (1997) 239-241. M. Biedermann, Y. Uematsu, K. Grob, Packag. Tech. Sci. 24 (2011) M. Biedermann, K. Grob, Eur. Food Res. Technol. 230 (2010) 785-796. A. Vollmer, M. Biedermann, F. Grundböck, J.E. Ingenhoff, S. Biedermann-Brem, W. Altkofer, K. Grob, Eur. Food Res. Technol. M. Biedermann, K. Grob, J. Chromatogr. A 1255 (2012) 76-99. German Federal Institute for Risk Assessment (BfR). Stellungnahme Nr. 008/2010 des BfR vom 03, December, 2009. Joint FAO/WHO Expert Committee of Food Additives (JECFA) 2002, 59th report, 11-20; WHO Technical report Series 913, http://whqlibdoc.who.int/trs/WHO_TRS_913.pdf. European
Reference [1] [2] [3] 61-73. [4] [5] 232 (2011) 175-182. [6] [7] [8] [9] 1-185. 1723-1726. 1155-1160. 1898-1903. (1991) 437-446. 8711-8721. 7476-7480. 100-111. (2012) 1-7. 221-226.
global w430×h280 The identification of the specific aromatic compounds, present in the MOAH “cloud”, was outside the scope of the investigation; however, even if desired, the identification of such constituents could not have been performed with satisfactory reliability, because of the low amounts of such constituents. However, it was possible to determine the MOAH quantities (FID trace) and patterns, which are highly important to define the contamination A series of peaks, present in the MOAH fraction, were identified as esterified fatty acids. However, their presence did not affect reliable quantification because these compounds were subtracted from the total MOAH area. The esterified fatty acids derived from t
source. observed. unidentified.