
Page 13 - Shimadzu Journal vol.1
P. 13
Food safety 50mM ammonium formate 0.1% Formic acid 87 96 99 81 56 78 90 76 74 53 98 92 84 78 86 64 93 76 100 84 100 100 74 53 100 83 13
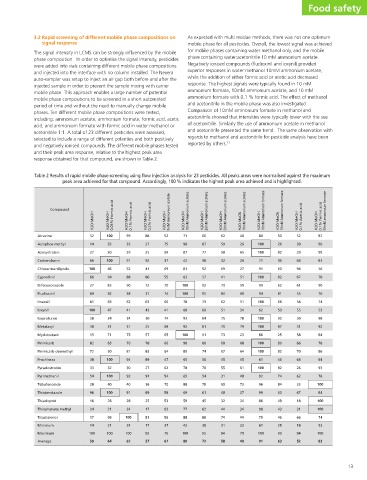
and acetonitrile presented the same trend. The same observation with
mobile phase for all pesticides. Overall, the lowest signal was achieved
As expected with multi residue methods, there was not one optimum
Table 2 Results of rapid mobile phase screening using flow injection analysis for 23 pesticides. All peaks areas were normalised against the maximum
regards to methanol and acetonitrile for pesticide analysis have been
acetonitrile showed that intensities were typically lower with the use
ammonium formate with 0.1 % formic acid. The effect of methanol
of acetonitrile. Similarly the use of ammonium acetate in methanol
for mobile phases containing water:methanol only, and the mobile
superior responses in water:methanol 10mM ammonium acetate,
phase containing water:acetonitrile 10 mM ammonium acetate.
while the addition of either formic acid or acetic acid decreased
Negatively ionised compounds (fludioxinil and ioxynil) provided
H2O:MeOH
ammonium formate, 10mM ammonium acetate, and 10 mM
response. The highest signals were typically found in 10 mM
Comparison of 10mM ammonium formate in methanol and
and acetonitrile in the mobile phase was also investigated.
peak area achieved for that compound. Accordingly, 100 % indicates the highest peak area achieved and is highlighted.
52 30 29 64 94 67 61 55 58 55 30 31 58 66 70 64 26 62 33 67 18 31 66 18 94 52
0.1% Acetic acid
H2O:MeOH
50 26 82 36 60 82 62 81 68 53 90 87 25 80 82 46 82 74 84 60 49 43 46 25 90 63
10mM Ammonium formate
H2O:MeCN
80 100 100 71 91 100 99 94 100 62 100 100 86 100 100 61 100 92 96 99 86 98 79 61 100 91
10mM Ammonium formate
H2O:MeOH
48 26 65 26 27 51 59 60 51 34 78 79 23 68 64 45 61 48 73 37 34 34 44 23 79 49
10mM Ammonium acetate
H2O:MeCN
reported by others. 13 50mM Ammonium acetate H2O:MeOH 20mM Ammonium acetate H2O:MeOH 62 66 59 87 58 77 32 38 69 92 41 57 73 92 84 95 62 73 51 60 75 84 76 81 73 91 68 80 67 74 45 56 55 70 31 54 65 78 48 61 32 45 44 62 74 86 31 38 84 95 58 72
71 98 87 42 81 63 100 100 78 60 93 92 100 90 85 65 78 65 88 69 59 77 88 42 100 80
10mM Ammonium acetate
H2O:MeOH
phase composition. In order to optimise the signal intensity, pesticides
including: ammonium acetate, ammonium formate, formic acid, acetic
and negatively ionised compounds. The different mobile phases tested
were added into vials containing different mobile phase compositions
auto-sampler was setup to inject an air gap both before and after the
The signal intensity in LCMS can be strongly influenced by the mobile
3.2 Rapid screening of different mobile phase compositions on
acid, and ammonium formate with formic acid in water:methanol or
and injected into the interface with no column installed. The Nexera
selected to include a range of different polarities and both positively
injected sample in order to prevent the sample mixing with carrier
mobile phase. This approach enables a large number of potential
52 75 69 37 69 55 70 74 66 41 74 68 65 66 64 47 62 54 70 58 53 62 56 37 75 61
period of time and without the need to manually change mobile
5mM Ammonium acetate
mobile phase compositions to be screened in a short automated
acetonitrile 1:1. A total of 23 different pesticides were assessed,
and their peak area response, relative to the highest peak area
H2O:MeOH
phases. Ten different mobile phase compositions were tested,
response obtained for that compound, are shown in Table 2.
88 27 25 92 41 86 72 37 63 43 30 25 57 78 83 89 27 91 36 89 25 17 81 17 92 57
0.2% Formic acid
H2O:MeOH
99 32 29 91 52 88 90 38 62 41 34 31 75 76 81 94 30 92 40 91 28 24 100 24 100 62
0.1% Formic acid
H2O:MeOH
100 32 30 100 46 94 85 42 69 47 34 31 71 85 90 100 32 100 40 100 28 21 96 21 100 64
0.05% Formic acid
H2O:MeOH
52 14 27 66 100 66 27 69 85 100 28 30 15 82 72 38 33 54 28 96 16 24 17 14 100 50
H2O:MeOH
signal response Compound Atrazine Azinphos-methyl Azoxystrobin Carbendazim Chlorantraniliprole Cyprodinil Difenoconazole Fludioxinil Imazalil Ioxynil Isoproturon Metalaxyl Myclobutanil Pirimicarb Pirimicarb-desmethyl Prochloraz Pyraclostrobin Pyrimethanil Tebufenozide Thiabendazole Thiacloprid Thiophanate methyl Triadimenol Minimum Maximum Average
0.9980 0.9998 0.9973 0.9956 0.9989 0.9950 0.9987 0.9991 0.9995 0.9991 0.9967 0.9983 0.9985 0.9982 0.9993 0.9996 0.9992 0.9969 0.9993 0.9994 0.9996 0.9991 0.9963 0.9993 0.9951 0.9980
R 2
%RSD (10ppb) 1.5 0.9 3.6 3.8 1.3 2.6 1.5 1.0 2.4 1.1 1.1 3.0 2.6 3.7 1.5 4.4 1.5 8.9 2.3 1.2 1.3 4.6 4.8 1.9 1.3 9.7
Transition 2 LOD (ppb) 0.10 0.28 0.40 0.52 0.09 0.55 2.50 0.50 0.08 0.18 0.62 0.73 0.31 0.54 0.36 0.26 0.12 1.81 0.20 0.05 0.09 3.12 3.53 0.41 0.29 5.00
Transition 1 LOD (ppb) 0.04 0.30 0.29 0.55 0.09 0.29 2.50 0.10 0.04 0.08 0.25 0.28 0.24 0.24 0.42 0.09 0.02 1.95 0.10 0.02 0.09 1.76 0.92 0.40 0.09 1.09
Pear extract RT (min.) 13.5 15.2 15.3 12.1 12.1 13.2 8.2 7.9 5.3 10.6 9.7 15.3 12.8 13.1 9.6 10.1 12.9 11.1 8.3 14.6 14.8 14.2 11.7 13.2 14.0 10.3
Transition 2 353 > 297 334 > 147 379 > 359 321 > 171 305 > 97 372 > 70 202 > 131 253 > 90 292 > 181 355 > 108 343 > 311 384 > 91 294 > 197 298 > 70 402 > 167 287 > 170 314 > 119 254 > 196 C9H7N3S ʔφϧຊମͷ߹ 190 > 163 409 > 145 346 > 43 ͠ 357 > 176 437 > 392 320 > 70 336 > 159 219 > 125
ᶇ Table 1-5 Studied compounds and their chemical formulas, CAS numbers, SRMs, retention times, limits of detection and R 2 Transition 1 353 > 133 334 > 117 379 > 339 321 > 97 305 > 187 372 > 159 202 > 175 253 > 126 292 > 211 355 > 88 343 > 151 384 > 197 294 > 69 296 > 70 402 > 141 287 > 198 314 > 162 256 > 198 190 > 136 409 > 186 346 > 278 357 > 154 435 > 390 318 > 70 336 > 187 219 > 161
112410-23-8 119168-77-3 83121-18-0 56070-16-7 10548-10-4 112281-77-3 148-79-8 111988-49-9 153719-23-4 59669-26-0 23564-05-8 129558-76-5 43121-43-3 55219-65-3 82097-50-5 112143-82-5 24017-47-8 55336-06-3 41814-78-2 141517-21-7 68694-11-1 64628-44-0 26644-46-2 131983-72-7 156052-68-5 (This table is a part of the article "Multi-Residue Analysis of 210 Pesticides in Food Samples by Triple Quadrupole UHPLC-MS/MS" in Shimadzu Journal vol.1, issue 1.)
CAS Triflumuron*ͷΈඞཁແ 94-75-7
global w430×h280 Formula C22H28N2O2 C18H24ClN3O C14H6Cl2F4N2O2 C9H21O4PS3 C9H21O3PS3 C13H11Cl2F4N3O C10H7N3S C10H9ClN4S C8H10ClN5O3S C10H18N4O4S3 C12H14N4O4S2 C21H22ClN3O2 C14H16ClN3O2 C14H18ClN3O2 C14H16ClN5O5S C11H18N4O3S C12H16N3O3PS C7H4Cl3NO3 ϟ δ C20H19F3N2O4 C15H15ClF3N3O C15H10ClF3N2O3 C10H14Cl6N4O2 C17H20ClN3O C14H16Cl3NO2 C8H6Cl2O3 * Negative electrospray ionisation
Food safety Compound Tebufenozide Tebufenpyrad Teflubenzuron* Terbufos sulfone Terbufos sulfoxide Tetraconazole Thiabendazole Thiacloprid Thiamethoxam Thiodicarb Thiophanate-methyl Tolfenpyrad Triadimefon Triadimenol Triasulfuron Triazamate acid* Triazophos Triclopyr* Tricyclazole Trifloxystrobin Triflumizole Triforine Triticonazole Zoxamide 2,4-D*