
Page 15 - Shimadzu Journal vol.1
P. 15
Food safety 15
pear extract. All 210 pesticides achieved excellent correlation coefficients
A limit of detection less than 0.001 mg kg -1 (1ppb) was achieved for the
sample: (1) acetonitrile, (2) dried fruit extract, (3) lettuce extract and, (4)
than 0.997. Correlation coefficients are listed in Table 1 for all pesticides
described by the US-EPA (see experimental section). Limits of detection
volume of only 2 µL. Therefore, detection limits could be reduced even
greater than 0.99 in all four types of matrix with typical values greater
Furthermore, these limits of detection were achieved with an injection
qualifying transition for 90 % of compounds: thereby highlighting the
further with larger injection volumes. An injection volume of 2 µL was
used in the study to allow the injection of 100 % acetonitrile extracts
in pear extract, and the calibration curves of eight selected pesticides
were assessed for both the quantifying transition and the qualifying
extracts. Linearity was assessed from 0.5 – 200 ppb in four types of
presented LODs less than the 0.01 mg kg -1 reporting level for both
Pesticide limits of detection were calculated based on the method
quantifying transition and less than 0.002 mg kg -1 (2 ppb) for the
transition and are listed in Table 1. All of the studied pesticides
excellent sensitivity of the LCMS-8040 for pesticide analysis.
without detriment to early eluting peak shapes. Repeatability was assessed at the 0.01 mg kg -1 reporting level as peak area %RSD for six replicate injections in pear extracts. Repeatability less than 5 %RSD was achieved for 92 % of the 210 pesticides studied. All of the studied compounds presented repeatability less than 10 %RSD, with exception of haloxyfop acid (13.4 %).
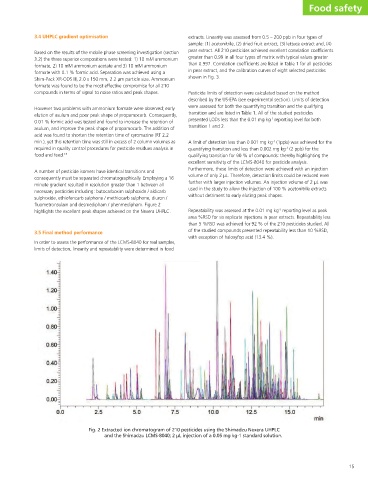
shown in Fig. 3. transition 1 and 2. Fig. 2 Extracted ion chromatogram of 210 pesticides using the Shimadzu Nexera UHPLC ɹ and the Shimadzu LCMS-8040; 2 µL injection of a 0.05 mg kg-1 standard solution.
3.4 UHPLC gradient optimisation Based on the results of the mobile phase screening investigation (section 3.2) the three superior compositions were tested: 1) 10 mM ammonium formate, 2) 10 mM ammonium acetate and 3) 10 mM ammonium formate with 0.1 % formic acid. Separation was achieved using a Shim-Pack XR-ODS III, 2.0 x 150 mm, 2.2 µm particle size. Ammonium formate was found to be the most effective compromise for all 210 compounds in terms of signal to noise ratios and peak shapes. However two problems with ammonium formate were observed; early elution of asulum and poor peak shape of propamocarb. Consequently, 0.01 % formic acid was tested and found to increase the retention of asulum, and im
auto-sampler (SIL-30AC) pre-treatment program to perform this function.
The performance optimising injection sequence (POISe) was evaluated by
mobile phase already. Table 3 lists the peak width for 11 early eluting
with peak widths reduced by 5-69%. The optimum amount of water
to inject following the sample was found to be 30 µL. Increasing this
volume to 40 µL did not provide any significant improvements. Early
the sample solvent elution strength, which has a large impact on the
higher retention factors. This improvement is due to the reduction in
solvent band to a much larger extent in comparison to analytes with
injecting between 5 – 40 µL of water following a 3 µL injection of pear
eluting compounds are affected by the injection of a weak eluting
early eluting compounds. Whereas, analytes with higher retention
dispersion was minimised considerably for early eluting pesticides,
show the improvement using the POISe on early eluting analytes.
compounds. Compounds are arranged in retention time order to
factors will experience some degree of band compression in the
performance optimising injection sequence. Using POISe, band
Fig.1 shows the injection of pear extract with and without the
extract in 100% acetonitrile. This was achieved using the Nexera
Fig.1 Pear extract (0.050 mg kg -1 ) injected without (A) and with (B) the performance optimising injection sequence
(B) 3 µL pear extract injection with the POISe (30 µL water)
Table 3 Peak widths obtained with and without the performance optimising injection sequence
Peak width change (%) -60.9 -49.5 -68.0 -69.1 -64.2 -46.3 -21.8 -17.8 -35.2 -10.5 -5.6
Peak width (min.) With Without POISe POISe 0.466 1.193 0.473 0.937 0.247 0.773 0.205 0.664 0.195 0.545 0.247 0.460 0.248 0.317 0.254 0.309 0.271 0.418 0.248 0.277 0.220 0.233
Compound No. Methamidophos 1 Propamocarb 2 Omethoate 3 Butocarboxim 4 sulfoxide Aldicarb sulfoxide 5 Dinotefuran 6 Oxamyl 7 DMPF 8 Demeton-S-methyl 9 sulfoxide Demeton-S-methyl 10 sulphone Ethiofencarb sulphone 11
global w430×h280 3.3 Performance Optimising Injection Sequence (POISe) In reversed phase UHPLC, early eluting compounds typically display the greatest peak distortion. Peak distortion is a particular problem is pesticide analysis as samples are typically extracted by QuEChERS, with samples diluted in 100% acetonitrile (a strong eluting solvent). To solve this issue, laboratories may decide to dilute the acetonitrile extracts in water before LCMS injection. However, doing so adds an additional sample preparation step and dilution in water can also negatively affect the stability of some analytes. 14 To minimise peak dispersion with the injection of acetonitrile extracts, one potential solution is the use of a band
Food safety 14