Page 6 - Shimadzu SPM-8100FM
P. 6

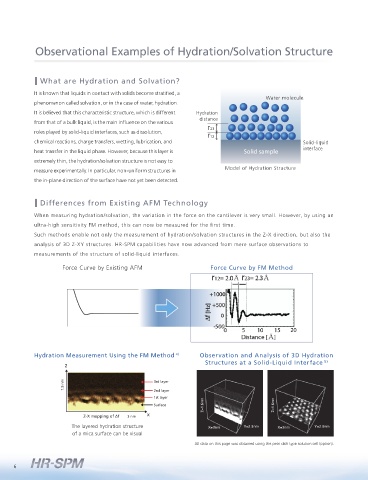
Observational Examples of Hydration/Solvation Structure


                      What are Hydration and Solvation?                                                                                        The Hydration/Solvation Measurement Method

                    It is known that liquids in contact with solids become stratified, a                                                      1. Run the HR-SPM in a solution, bringing the cantilever close to the surface of the solid sample with high precision, up to the settings value (fmax).
                                                                                                Water molecule
                    phenomenon called solvation, or in the case of water, hydration.                                                          2. Use the force curve method to measure the force on the probe on the tip of the cantilever.
                    It is believed that this characteristic structure, which is different   Hydration                                         3. Variations in characteristic power ( f) in accordance with the sample can be obtained in the immediate vicinity of the solid-liquid interface.
                                                                          distance
                    from that of a bulk liquid, is the main influence on the various                                                          4. Variation of the force is due to hydration/solvation, which provides insight into the stratification structure in the liquid.
                                                                             r23
                    roles played by solid-liquid interfaces, such as dissolution,                                                             5. A cross section of the hydration/solvation structure can be visualized by performing continuous acquisition in the X-direction (Z-X measurement).
                                                                             r12
                    chemical reactions, charge transfers, wetting, lubrication, and                          Solid-liquid                     6. Furthermore, the 3D structure of the solid-liquid interface can be analyzed by acquiring Z-X measurements in the Y direction.
                    heat transfer in the liquid phase. However, because this layer is    Solid sample        interface                                                     Tip Scanning Trace
                                                                                                                                                      z              z                           z
                    extremely thin, the hydration/solvation structure is not easy to                                                                                              AFM Tip                 Water   AFM Probe
                                                                                   Model of Hydration Structure                                                                                          molecule
                    measure experimentally. In particular, non-uniform structures in                                                                                                                     Density
                                                                                                                                                                                                                    Large     Interaction force
                    the in-plane direction of the surface have not yet been detected.                                                                                         Measurement                  Sparse          Small
                                                                                                                                                                                 Z-X
                                                                                                                                                               Variation                                    Dense                 Large
                                                                                                                                                                 of
                      Differences from Existing AFM Technology                                                                                                 the Force                                   Sparse
                                                                                                                                                          0      f                                          Dense
                    When measuring hydration/solvation, the variation in the force on the cantilever is very small. However, by using an                    f max
                                                                                                                                                        Force curve                       x                 Dense
                    ultra-high sensitivity FM method, this can now be measured for the first time.                                                                 y
                                                                                                                                                                                                Density distribution function
                    Such methods enable not only the measurement of hydration/solvation structures in the Z-X direction, but also the                                                                  g (z)
                                                                                                                                                                     Sample surface
                    analysis of 3D Z-XY structures. HR-SPM capabilities have now advanced from mere surface observations to                          Pattern Diagram of Hydration/Solvation Measurement  Diagram of Hydration/Solvation Measurement
                    measurements of the structure of solid-liquid interfaces.

                             Force Curve by Existing AFM                      Force Curve by FM Method                                         Data Analysis Software

                                                                                                                                              This software is designed specifically for 3D mapping data analysis. It provides powerful support for analyzing hydration
                                                                                                                                              and solvation structure data.


                                                                                                                                                       2D image data                                                           3D display

                    Hydration Measurement Using the FM Method      4)      Observation and Analysis of 3D Hydration
                                                                            Structures at a Solid-Liquid Interface  5)
                              Z

                             1.5 nm                        3rd layer
                                                           2nd layer
                                                           1st layer
                                                                            Z=1.6nm                Z=1.6nm
                                                           Surface                                                                                       1D data
                                    Z-X mapping of  f  3 nm  X
                                The layered hydration structure              X=3nm       Y=2.3nm    X=3nm        Y=2.3nm                                              Displaying 3D mapping data
                                of a mica surface can be visual                                                                                                       Extracting and displaying 2D images from the mapping data
                                                                         All data on this page was obtained using the petri dish type solution cell (option).         Displaying and analyzing specified 1D data over 2D image data

                                                                                                                                                                                                                                SPM-8100FM
             6                                                                                                                                                                                                                High Resolution Scanning Probe Microscope  7
   1   2   3   4   5   6   7   8   9   10   11