Page 4 - Shimadzu SPM-8100FM
P. 4

Differences From Existing SPM/AFM                                                                                         Examples of Observations in Liquids


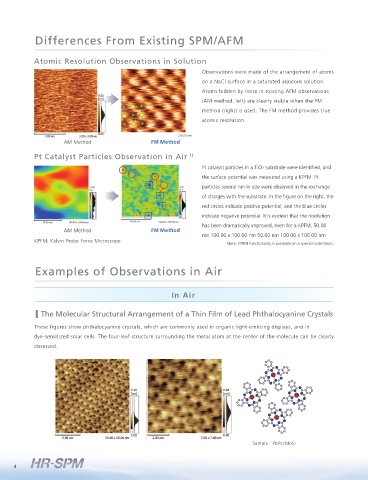
                    Atomic Resolution Observations in Solution                                                                                                                           In Liquid

                                                                           Observations were made of the arrangement of atoms
                                                                           on a NaCl surface in a saturated aqueous solution.
                                                                                                                                               Molecular Structure of Proteins            2)
                                                                           Atoms hidden by noise in existing AFM observations
                                                                                                                                              Egg-white lysozyme was observed in a saturated aqueous   can not be observed using the existing AFM, while four
                                                                           (AM method, left) are clearly visible when the FM
                                                                                                                                              solution. Protein molecules (the circles in the figure at   protein molecules were observed using HR-SPM and the
                                                                           method (right) is used. The FM method provides true
                                                                                                                                              left) can be observed within the surface unit cell (the   images are consistent with the model image shown in the
                                                                           atomic resolution.
                                                                                                                                              square in the figure at right). The inside of the unit cell   figure at right.
                                                                   2.0×2.0 nm
                              AM Method                   FM Method
                                                                                                                                                                                                       11.1 nm     (110)
                    Pt Catalyst Particles Observation in Air            1)
                                                                                                                                                                                                               3.8 nm
                                                                           Pt catalyst particles in a TiO2 substrate were identified, and
                                                                           the surface potential was measured using a KPFM. Pt
                                      -0.80                         0.25   particles several nm in size were observed in the exchange
                                      [V]                           [V]
                                                                           of charges with the substrate. In the figure on the right, the
                                                                           red circles indicate positive potential, and the blue circles                                                  4 3 helices              5 nm
                                                                           indicate negative potential. It is evident that the resolution                                 Model of the Crystalline Structure of the Surface of Lysozyme (110)
                       50.00 nm  100.00 x 100.00 nm  50.00 nm  100.00 x 100.00 nm
                                                                           has been dramatically improved, even for a KPFM. 50.00
                              AM Method                   FM Method
                                                                           nm 100.00 x 100.00 nm 50.00 nm 100.00 x 100.00 nm                   Mixed Crystalline Structures
                    KPFM: Kelvin Probe Force Microscope
                                                                                    Note: KPFM functionality is available on a special order basis.
                                                                                                                                                                            2.82 A   5.64 A              This illustrates the observation of
                                                                                                                                                      NaCl     MgCl2
                                                                                                                                                                                                         epitaxially-grown Na2MgCl4 crystals on a single
                    Examples of Observations in Air                                                                                                      (Na, Mg)Cl?                         Na          NaCl crystal surface in a mixed solution.
                                                                                                                                                                                              Cl
                                                                                                                                                                                                         Because the crystalline structure can be
                                                                                                                                                           NaCl
                                                                                                                                                                                          3.99 A
                                                                                                                                                                                                         observed, this technique can be used to identify
                                                                 In Air
                                                                                                                                                                                                         the structure of mixed samples.
                      The Molecular Structural Arrangement of a Thin Film of Lead Phthalocyanine Crystals


                    These figures show phthalocyanine crystals, which are commonly used in organic light-emitting displays, and in
                    dye-sensitized solar cells. The four-leaf structure surrounding the metal atom at the center of the molecule can be clearly
                    observed.

                                                                                                                                               Atomic Structure of a Calcite Cleavage Plane                3)

                                                                                                                                                                                                         This is an atomic-resolution observation of

                                                                                                                                                                                            [421]        surface structure in a liquid medium. Defects
                                                                                                                                                         Defect
                                                                                                                                                                                                         in the calcite surface are evident in the figure
                                                                                                                                                                                                         at left.
                                                                                                                                                                 [421]                   [010]


                                                                                                                                                               [010]
                                                                                                                                                                                                                          All data on this page was obtained using
                                                                                            Sample : PbPc/MoS2                                    2.00 nm          8.00 × 8.00 nm  10.00 nm  21.00 × 21.00 nm              the petri dish type solution cell (option).

                                                                                                                                                                                                                                SPM-8100FM
             4                                                                                                                                                                                                                High Resolution Scanning Probe Microscope  5
   1   2   3   4   5   6   7   8   9