
Page 7 - Shimadzu iMScope QT
P. 7
Quantification and Distribution
Obtain qualitative and quantitative information from LC-MS as well as position
information from mass spectrometry imaging (MSI) with a single instrument.
The combined system, which can perform LC-MS analysis in addition to
MSI analysis, provides both distribution information and quantitative analysis.
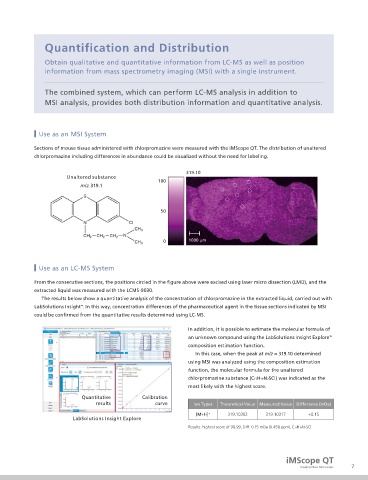
Use as an MSI System
Sections of mouse tissue administered with chlorpromazine were measured with the iMScope QT. The distribution of unaltered
chlorpromazine including differences in abundance could be visualized without the need for labeling.
319.10
Unaltered substance
100
m/z 319.1
50
0 1000 µm
Use as an LC-MS System
From the consecutive sections, the positions circled in the gure above were excised using laser micro dissection (LMD), and the
extracted liquid was measured with the LCMS-9030.
The results below show a quantitative analysis of the concentration of chlorpromazine in the extracted liquid, carried out with
LabSolutions Insight . In this way, concentration differences of the pharmaceutical agent in the tissue sections indicated by MSI
™
could be con rmed from the quantitative results determined using LC-MS.
In addition, it is possible to estimate the molecular formula of
an unknown compound using the LabSolutions Insight Explore
™
composition estimation function.
In this case, when the peak at m/z = 319.10 determined
using MSI was analyzed using the composition estimation
function, the molecular formula for the unaltered
chlorpromazine substance (C17H19N2SCl) was indicated as the
most likely with the highest score.
Quantitative Calibration
results curve Ion Types Theoretical Value Measured Value Difference (mDa)
[M+H] + 319.10302 319.10317 +0.15
LabSolutions Insight Explore
Results: highest score of 98.99, Diff. 0.15 mDa (0.458 ppm), C17H19N2SCl
iMScope QT
Imaging Mass Microscope 7