Page 8 - Shimadzu GCMS-QP2020 NX
P. 8

Smart Performance

                     Easily Obtains All the Information Required for Qualitative Analysis


                     With GC/MS, which has significant qualitative capabilities, a wealth of fragment information is obtained, so it is used   Smart EI/CI Ion Source Easily Switches Between EI and CI Methods
                     as a means of identifying unknown compounds. A mass spectral library is generally used as a means of compound
                     identification. However, experience with compound identification is required if the compound is not registered in the   The Smart EI/CI ion source has been developed in order to acquire CI data without switching the ion source, and
                     mass spectral library, or there are a number of compounds with similar structures. With the GCMS-QP2020 NX, in     without losing the  sensitivity of EI, which is most commonly used.
                     addition to the mass spectrum, three kinds of value-added compound information are used in combination to support   Even when it is difficult to perform identification with the EI mode using the mass spectral library, molecular weight
                     high-accuracy qualitative analysis.                                                                                information can be obtained from CI data, thus helping in the estimation of unknown compounds.

                                                                                                                                        100    EI            441                Exchange of    100   CI            441
                                                                                                                                                                                 ion source
                                                                                                                                         75    57                               unnecessary    75
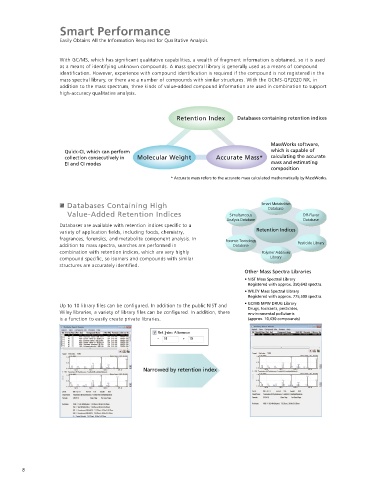
                                                            Retention Index     Databases containing retention indices
                                                                                                                                         50                                                    50                           647
                                                                                                                                         25                                                    25

                                                                                                                                             91   191   308 385                                     106       329 385  483  591
                                                                                                                                             0                                                     0
                                                                                           MassWorks software,                                      250        500                                        250         500
                      Quick-CI, which can perform                                          which is capable of                                   Confirmation of Mass Spectra  Smart EI/CI Ion Source  Confirmation of Molecular Weight Information
                      collection consecutively in  Molecular Weight      Accurate Mass*    calculating the accurate
                      EI and CI modes                                                      mass and estimating
                                                                                           composition
                                                                                                                                                                                                                       MW:646
                                                          * Accurate mass refers to the accurate mass calculated mathematically by MassWorks.


                       Databases Containing High                                        Smart Metabolites
                                                                                          Database
                       Value-Added Retention Indices                         Simultaneous            Off-Flavor
                                                                            Analysis Database        Database                                                                                                       m/z 441
                     Databases are available with retention indices specific to a                                                        EI Data                                                       It can be estimated that the peak
                     variety of application fields, including foods, chemistry,        Retention Indices                                 CI Data                                                       shown with an asterisk in the graph
                     fragrances, forensics, and metabolite component analysis. In   Forensic Toxicology                                        5.0    7.5   10.0   12.5  15.0   17.5  20.0   22.5 min  on the left is Tris
                     addition to mass spectra, searches are performed in      Database              Pesticide Library                       Analysis of Extracts from a Food Container (Extracted using 20% EtOH solution)  (2,4-di-t-butylphenyl) phosphite,
                     combination with retention indices, which are very highly          Polymer Additives                                                                                             which is used as an antioxidant,
                     compound specific, so isomers and compounds with similar               Library                                                                                                    based on the EI mass spectrum and
                     structures are accurately identified.                                                                                                                                             the molecular weight information
                                                                                  Other Mass Spectra Libraries                                                                                        provided by CI spectra.
                                                                                  • NIST Mass Spectral Library
                                                                                     Registered with approx. 350,643 spectra.              Estimating Composition Using Accurate Mass
                                                                                  • WILEY Mass Spectral Library
                                                                                     Registered with approx. 775,500 spectra.           The MassWorks software calculates the theoretical
                     Up to 10 library files can be configured. In addition to the public NIST and   • GC/MS MPW DRUG Library              accurate mass from the quadrupole MS mass profile. It                  m/z 371 Mass Profile (CI)
                                                                                     Drugs, toxicants, pesticides,
                     Wiley libraries, a variety of library files can be configured. In addition, there      environmental pollutants      then outputs candidate compositional formulas based
                     is a function to easily create private libraries.               (approx. 10,430 compounds)                         on isotopic ratios and the theoretical accurate mass. This
                                                                                                                                        software is useful for estimating the composition of
                                                                                                                                        compounds that are not registered in a mass spectral
                                                                                                                                        library.
                                                                                                                                                      ™
                                                                                                                                        The GCMSsolution  software can simultaneously output
                                                                                                                                        GC/MS data and mass profile data. The majority of
                                                                                                                                        compounds detected with the GC/MS data can be
                                                                                                                                        identified from a mass spectral library. MassWorks is
                                                Narrowed by retention index                                                             then used to estimate the composition of any
                                                                                                                                        compounds that are not identified, further increasing
                                                                                                                                        the quality of the qualitative analysis.
                                                                                                                                            (×10,000,000)
                                                                                                                                          7.5
                                                                                                                                          5.0
                                                                                                                                                                                      It is predicted to be diethylhexyl adipate (C22H42O4) based on the
                                                                                                                                          2.5                                         candidate compositional formula and the mass spectral pattern.
                                                                                                                                                                             EI Data
                                                                                                                                          0.0                                CI Data
                                                                                                                                             8.0   9.0  10.0  11.0  12.0  13.0
                                                                                                                                                Sample Analysis of Additives in a Polymer


        8                                                                                                                                                                                                                                    9
   3   4   5   6   7   8   9   10   11   12   13