Page 6 - Shimadzu AIRsight
P. 6

AIRsight


                     Applications


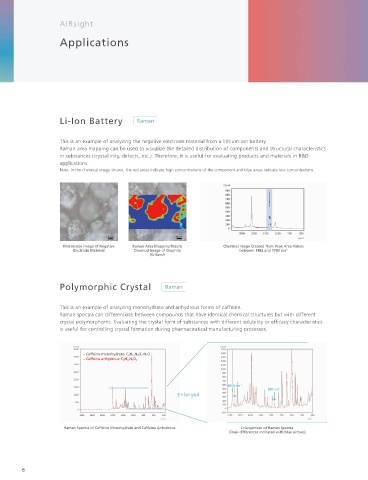
                     Li-Ion Battery                                                                                                     Multilayer Film                                     Microscope Image of
                                                                                                                                                                                            Multilayer Film Cross Section  Interior


                     This is an example of analyzing the negative electrode material from a lithium-ion battery.                        This is an example of analyzing a multilayer  lm.         Surface layer
                     Raman area mapping can be used to visualize the detailed distribution of components and structural characteristics   The distribution of each component can be visualized by using infrared
                     in substances (crystallinity, defects, etc.). Therefore, it is useful for evaluating products and materials in R&D   and Raman area mapping to analyze a cut cross section from the  lm.
                     applications.
                     Note: In the chemical image shown, the red areas indicate high concentrations of the component and blue areas indicate low concentrations.


                                                                                                                                        Infrared Area Mapping Results  Chemical Image Created from Peak   Raman Area Mapping Results  Chemical Image Created from Peak
                                                                                                                                       Chemical Image of Phthalate Esters  Areas between 1551 and 1624 cm -1  Chemical Image of Titanium   Area Values between 345 and 508 cm -1
                      Microscope Image of Negative   Raman Area Mapping Results  Chemical Image Created from Peak Area Values                                                              Oxide (Rutile)
                         Electrode Material  Chemical Image of Graphite         between 1482 and 1703 cm -1
                                                   (G-Band)


                     Polymorphic Crystal                                                                                                Automotive Paint Coating


                     This is an example of analyzing monohydrate and anhydrous forms of caffeine.                                       This is an example of analyzing an automotive paint coating. Samples with characteristics that make it dif cult to
                     Raman spectra can differentiate between compounds that have identical chemical structures but with different       cut a cross section can be evaluated by analyzing the component distribution in the depth direction by Raman
                     crystal polymorphisms. Evaluating the crystal form of substances with different solubility or ef cacy characteristics   spectroscopy and evaluating the degradation status or other criteria from the surface.
                     is useful for controlling crystal formation during pharmaceutical manufacturing processes.                         A separate mapping program (P/N 206-35093-41) is required.


                                                                                                                                                                X                       X
                             – Caffeine monohydrate: C 8 H 10 N 4 O 2 ·H 2 O                                                                                 Y                       Z
                             – Caffeine anhydrous: C 8 H 10 N 4 O 2


                                                                            1656 cm -1 -1
                                                                            1656 cm
                                                                                          887 cm -1 -1
                                                                                          887 cm

                                                                                                                                              Shiny Exterior   Microscope Image of Automotive   Raman Depth (Line) Mapping   Chemical Image Created from
                                                                                                                                                                     Paint Coating             Results        Peak Area Values between 1383
                                                                                                                                                               (Blue circles: Line axis in X-direction)  Chemical Image of Acrylic Resin  and 1510 cm -1
                      Raman Spectra of Caffeine Monohydrate and Caffeine Anhydrous  Enlargement of Raman Spectra
                                                                              (Peak differences indicated with blue arrows)


        6                                                                                                                                                                                                                                    7
   1   2   3   4   5   6   7   8   9   10   11