Page 4 - Shimadzu AIRsight
P. 4

AIRsight


                     Applications


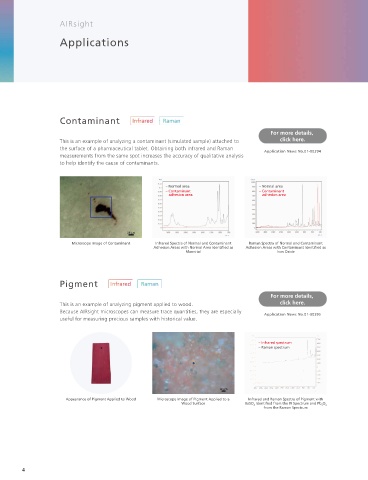
                     Contaminant                                                                                                        Microplastic

                                                                                           For more details,                                                                                                  For more details,
                     This is an example of analyzing a contaminant (simulated sample) attached to   click here.                         This is an example of analyzing a microplastic particle. The ability to measure   click here.
                     the surface of a pharmaceutical tablet. Obtaining both infrared and Raman                                          infrared and Raman spectra from a wide range of microplastic particle sizes, from
                                                                                         Application News No.01-00394                                                                                       Application News No.01-00396
                     measurements from the same spot increases the accuracy of qualitative analysis                                     a few micrometers to several tens of micrometers in diameter, makes the system
                     to help identify the cause of contaminants.                                                                        ideal for monitoring survey and research applications.


                                                        – Normal area                  – Normal area
                                                        – Contaminant                  – Contaminant
                                                         adhesion area                  adhesion area


                                                                                                                                          Microscope Image of Microplastic  Infrared Spectrum of 115 µm Long   Microscope Image of Microbead  Raman Spectrum of 1 µm Diameter
                                                                                                                                                               (Major Axis) and 53 µm Wide (Minor            Microbead Identi ed as Polystyrene
                                                                                                                                                                 Axis) Microplastic Identi ed as
                                                                                                                                                                      Polystyrene
                         Microscope Image of Contaminant  Infrared Spectra of Normal and Contaminant   Raman Spectra of Normal and Contaminant
                                                    Adhesion Areas with Normal Area Identi ed as   Adhesion Areas with Contaminant Identi ed as
                                                              Mannitol                       Iron Oxide


                     Pigment                                                                                                            Carbon Material
                                                                                           For more details,                                                                                                  For more details,
                     This is an example of analyzing pigment applied to wood.                 click here.                               This is an example of analyzing a diamond-like carbon (DLC)  lm.         click here.
                     Because AIRsight microscopes can measure trace quantities, they are especially   Application News No.01-00395      Raman measurements can determine bonds and structures in carbon materials   Application News No.01-00397
                     useful for measuring precious samples with historical value.                                                       with high sensitivity for use in quality control of DLC  lms.

                                                                                                                                                                                           I(D)/I(G)     FWHM(G)      log(N(G)/I(G))
                                                                                                                                                                                        Disturbances in   Crystallinity, Young’s   Hydrogen
                                                                                       – Infrared spectrum                                                                              Crystal Structure  Modulus, and Density  Concentration
                                                                                       – Raman spectrum

                                                                                                                                                                           CH 4 _center     0.32          182.17        -0.29

                                                                                                                                                                           CH 4 _periphery  0.32          181.40        -0.28

                                                                                                                                                                           C 2 H 2 _center  0.34          190.85        -0.44
                       Appearance of Pigment Applied to Wood  Microscope Image of Pigment Applied to a   Infrared and Raman Spectra of Pigment with
                                                             Wood Surface         BaSO 4  Identi ed from the IR Spectrum and Pb 3 O 4              Raman shift / cm -1
                                                                                        from the Raman Spectrum                                                            C 2 H 2 _periphery  0.34       190.25        -0.44
                                                                                                                                           Diagram of Evaluation Parameters for Raman
                                                                                                                                                 Spectrum of a DLC Film
                                                                                                                                                                            Results from Evaluating DLC Film (Formed with Either CH 4  or C 2 H 2  Gas) on Two Types of Silicon
                                                                                                                                                                                Wafers (Measured in Two Locations—Near the Sample Center and Periphery)


        4                                                                                                                                                                                                                                    5
   1   2   3   4   5   6   7   8   9