Page 14 - Shimadzu AA-6880
P. 14

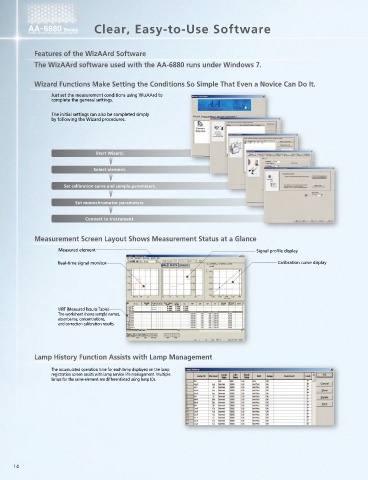
Clear, Easy-to-Use Software


            Features of the WizAArd Software                                                                                          Software Provides Comprehensive Information Displays and Flexible Settings
            The WizAArd software used with the AA-6880 runs under Windows 7.

                                                                                                                                      Identical software operation for flame and furnace measurements
            Wizard Functions Make Setting the Conditions So Simple That Even a Novice Can Do It.
                                                                                                                                        Even if the calibration curve is created after sample measurements,
                  Just set the measurement conditions using WizAArd to                                                                  concentration calculations can be conducted on past data. This
                  complete the general settings.                                                                                        allows trial measurements to be directly used as actual
                                                                                                                                        measurements.
                  The initial settings can also be completed simply
                  by following the Wizard procedures.                                                                                   Extrapolation of calibration curve range. If the sample concentration
                                                                                                                                        exceeds the calibration curve range, additional measurements can be
                                                                                                                                        performed on standard solutions to re-calculate the concentration.
                                                                                                                                        Use existing calibration curves for measurements. Useful for sample
                                                                                                                                        concentration order checks and for checking the instrument
                                 Start Wizard.                                                                                          sensitivity.

                                Select element.                                                                                         One-touch re-measurement operation. No need to repeat the
                                                                                                                                        measurement from the beginning.

                      Set calibration curve and sample parameters.                                                                      Create and save multiple calibration curves on a single worksheet.
                                                                                                                                        Select the appropriate calibration curve for the sample concentration
                                                                                                                                        and composition.
                          Set monochromator parameters.

                                                                                                                                      Combining a high-performance autosampler simplifies advanced settings
                                                                                                                                                                                                                  g
                                                                                                                                                                                          p
                             Connect to instrument.
                                                                                                                                        Real-time drying and ashing progress display for furnace
                                                                                                                                        measurement
            Measurement Screen Layout Shows Measurement Status at a Glance                                                              A higher temperature cleaning operation than the cleaning stage
                                                                                                                                        can be added for each measurement. This reduces the graphite tube
                    Measured element                                                  Signal profile display                            memory effect. Tube deterioration is reduced by minimizing the
                                                                                                                                        cleaning operations.
                    Real-time signal monitor                                                 Calibration curve display
                                                                                                                                        Add optional autosampler rinsing operations to ensure adequate
                                                                                                                                        rinsing of the autosampler after completing the measurement of
                                                                                                                                        high-concentration samples.
                                                                                                                                        Set up sample dilution and spike-and-recovery tests on the same
                                                                                                                                        screen.
                    MRT (Measured Results Table)
                    The worksheet shows sample names,
                    absorbance, concentrations,
                    and correction calibration results.

                                                                                                                                        Overlay function allows size and shape comparison of peak profiles.

                                                                                                                                        Large-volume injection permits high-sensitivity measurements.
            Lamp History Function Assists with Lamp Management
                                                               g
                                                                                                                                        Precision control of drying and ashing temperatures reduces analysis
                  The accumulated operation time for each lamp displayed on the lamp                                                    time.
                  registration screen assists with lamp service life management. Multiple
                  lamps for the same element are differentiated using lamp IDs.


     14                                                                                                                                                                                                                                        15
   9   10   11   12   13   14   15   16   17   18   19