
Page 13 - Shimadzu AA-6880
P. 13
$$ Dual-Background Correction Functions
The optimal background correction methods are installed as standard:
high-speed self-reversal method (SR method) and deuterium lamp method (D2 method).
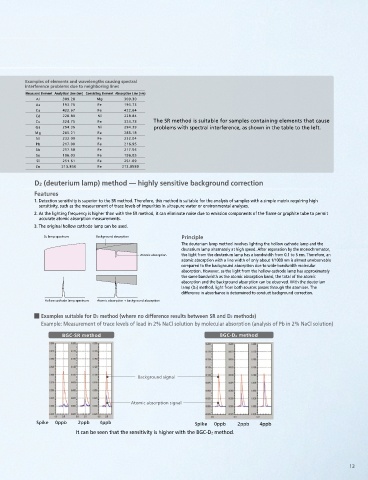
Examples of elements and wavelengths causing spectral
These functions can correct for spectral interference in flame measurement. interference problems due to neighboring lines
Selecting the optimal background correction method for each sample ensures Measured Element Analytical Line (nm) Coexisting Element Absorption Line (nm)
309.28
309.30
Mg
Al
accurate and reliable analysis results. As 193.76 Fe 193.73
Ca 422.67 Fe 422.64
Cd 228.80 Ni 228.84
Cu 324.75 Fe 324.73 The SR method is suitable for samples containing elements that cause
Samples suitable for the SR method Samples suitable for the D2 method Ga 294.36 Ni 294.39 problems with spectral interference, as shown in the table to the left.
Mg 285.21 Fe 285.18
Ni 232.00 Fe 232.04
Samples with a complex matrix Purified water, tap water, environmental water, etc.
Pb 217.00 Fe 216.95
(Containing a large quantity of a specific element as the main component) Samples with a relatively simple matrix Sb 217.58 Fe 217.55
Se 196.03 Fe 196.05
Si 251.61 Fe 251.69
Zn 213.856 Fe 213.8589
SR (high-speed self-reversal) method –– accurate background correction over a wide range D2 (deuterium lamp) method –– highly sensitive background correction
Features Features
1. High-speed self-reversal (SR) correction is generally more accurate than deuterium lamp (D2) correction. As both atomic absorption and background 1. Detection sensitivity is superior to the SR method. Therefore, this method is suitable for the analysis of samples with a simple matrix requiring high
absorption can be measured using a single lamp, the correction errors due to light-axis misalignment are extremely small. This is ideal for the quantitation sensitivity, such as the measurement of trace levels of impurities in ultrapure water or environmental analyses.
of trace components in a matrix exhibiting complex background absorption, such as bio-samples and metals.
2. As the lighting frequency is higher than with the SR method, it can eliminate noise due to emission components of the flame or graphite tube to permit
2. Permits background correction over the entire wavelength range from 185 nm to 900 nm. accurate atomic absorption measurements.
3. This method can correct for spectral interference due to neighboring lines that can occur when a resonance line for another element exists near the 3. The original hollow cathode lamp can be used.
analytical line for the target element. (See table on next page.)
4. As no polarizer is used, measurements are possible with low light losses and a high S/N ratio. D2 lamp spectrum Background absorption Principle
The deuterium lamp method involves lighting the hollow cathode lamp and the
5. The rapid lamp lighting permits accurate measurement unaffected by emission noise in the atomizer.
deuterium lamp alternately at high speed. After separation by the monochromator,
* Hollow cathode lamp L-2433 is required to use the SR method. It can also be used for the D2 method. Atomic absorption the light from the deuterium lamp has a bandwidth from 0.1 to 5 nm. Therefore, an
atomic absorption with a line width of only about 1/1000 nm is almost unobservable
Background absorption Principle
IH spectrum compared to the background absorption due to wide-bandwidth molecular
Background A small current IL (approx. 10 mA) and a large current IH (approx. 500 absorption. However, as the light from the hollow cathode lamp has approximately
Atomic absorption mA) are alternately passed through the hollow cathode lamp. The the same bandwidth as the atomic absorption band, the total of the atomic
Atomic lamp emission spectrum when the large current flows has a depression absorption and the background absorption can be observed. With the deuterium
Lamp current Wavelength Wavelength Atomic in the center (self-reverse), due to self-absorption of the large number lamp (D2) method, light from both sources passes through the atomizer. The
absorption
IH
of sputtered atoms in the atom cloud, as shown in the diagram to the
difference in absorbance is determined to conduct background correction.
IL
layer
IL spectrum Absorption absorption left. No significant atomic absorption is apparent and background Hollow cathode lamp spectrum Atomic absorption + background absorption
absorption mainly occurs. Conversely, the lamp emission spectrum
Background when the small current flows comprises a single narrow peak resulting
Time from both atomic absorption and background absorption. By
Atomic absorption Examples suitable for D2 method (where no difference results between SR and D2 methods)
determining the difference between the two types of absorption, it is
possible to accurately correct for the background absorption and Example: Measurement of trace levels of lead in 2% NaCl solution by molecular absorption (analysis of Pb in 2% NaCl solution)
(Lamp energy) (Sample measurement) (Energy component ratio)
measure the true atomic absorption.
BGC-SR method BGC-D2 method
Examples suitable for SR method (where differences result between SR and D2 methods)
Example: Measurement of trace levels of zinc in iron (analysis of Zn in Fe solution)
BGC-SR method BGC-D2 method
Zn 0.25ppm
Atomic absorption signal Atomic absorption signal
Background signal Zn 0.50ppm Background signal
Background signal
Fe 0.1%
Fe 0.5%
Fe 0.5% Zn 0.25ppm
Atomic absorption signal
Fe 0.5% Zn 0.5ppm
Fe 0.75% Zn 0.3ppm
Spike 0ppb 2ppb 4ppb Spike 0ppb 2ppb 4ppb
The identical 0.5 ppm Zn solution is accurately corrected to Due to inadequate correction, the absorbance is higher at
the same absorbance at (2) and (6). (6) than at (2) for the identical 0.5 ppm Zn solution. It can be seen that the sensitivity is higher with the BGC-D2 method.
12 13