
Page 9 - Application Notebook - PFAS Analysis
P. 9
SHIMADZU | WHITE PAPER Ultra-fast LC-MS/MS Analysis of PFAS in Environmental Waters
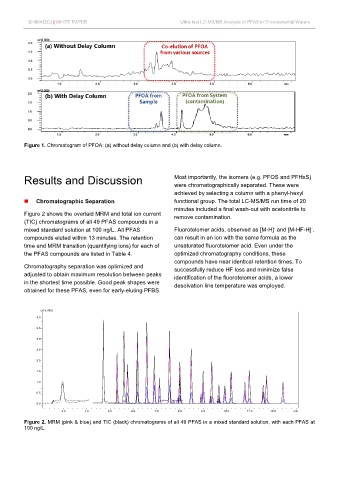
Figure 1. Chromatogram of PFOA: (a) without delay column and (b) with delay column.
Results and Discussion Most importantly, the isomers (e.g. PFOS and PFHxS)
were chromatographically separated. These were
achieved by selecting a column with a phenyl-hexyl
Chromatographic Separation functional group. The total LC-MS/MS run time of 20
minutes included a final wash-out with acetonitrile to
Figure 2 shows the overlaid MRM and total ion current remove contamination.
(TIC) chromatograms of all 49 PFAS compounds in a
-
mixed standard solution at 100 ng/L. All PFAS Fluorotelomer acids, observed as [M-H] and [M-HF-H] ,
-
compounds eluted within 13 minutes. The retention can result in an ion with the same formula as the
time and MRM transition (quantifying ions) for each of unsaturated fluorotelomer acid. Even under the
the PFAS compounds are listed in Table 4. optimized chromatography conditions, these
compounds have near identical retention times. To
Chromatography separation was optimized and successfully reduce HF loss and minimize false
adjusted to obtain maximum resolution between peaks identification of the fluorotelomer acids, a lower
in the shortest time possible. Good peak shapes were desolvation line temperature was employed.
obtained for these PFAS, even for early-eluting PFBS.
(x10,000)
4.0
3.5
3.0
2.5
2.0
1.5
1.0
0.5
0.0
3.0 4.0 5.0 6.0 7.0 8.0 9.0 10.0 11.0 12.0 min
Figure 2. MRM (pink & blue) and TIC (black) chromatograms of all 49 PFAS in a mixed standard solution, with each PFAS at
100 ng/L.