Page 27 - Microorganism Species Analysis
P. 27

LCMS-2020                                                                                                                                                                                                           LCMS-2020
                                             Analysis of Nucleic Acids, Amino Acids, and Aflatoxins
            Microorganism Solutions                                                                                                                                                                                              Microorganism Solutions


                     LC/MS Analysis of Microorganism-Derived Components                                                                   Data
                     Liquid chromatography has been widely used for the analysis of microorganism-derived components. However, the UV
                     detector cannot achieve adequate sensitivity for compounds with almost no UV absorption. Sophisticated investigation of the   Analysis of Aflatoxins
                     separation conditions is often necessary, such as for the analysis of trace levels of components in a mixture. LC/MS uses a
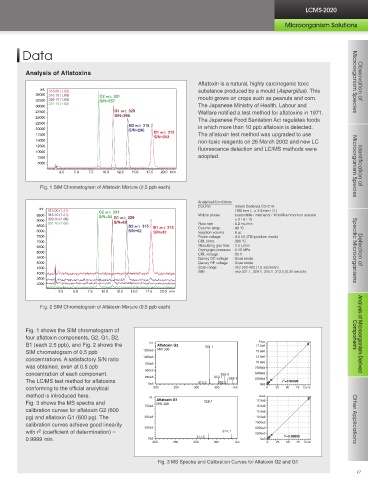
                                                                                                                                                                                                    Aflatoxin is a natural, highly carcinogenic toxic   Microorganism Species  Observation of
                     variety of methods to ionize the sample components. This method separates these ions in a vacuum according to the
                                                                                                                                                Int.  313.00 (1.22)                                 substance produced by a mould (Aspergillus). This
                     mass-to-charge ratio (m/z) and detects the ion intensities at high sensitivity. The mass is information unique to the molecule   35000  315.10 (1.00)  G2 m/z  331
                     and directly using this information makes it simple to analyze complex component mixtures.                               32500  329.10 (1.00)  S/N=557                         mould grows on crops such as peanuts and corn.
            Observation of
                                                                                                                                                  331.10 (1.00)
                     The Japanese Ministry of Health, Labour and Welfare has set and notified standards and test methods for mycotoxins such   30000                                                The Japanese Ministry of Health, Labour and
                                                                                                                                              27500                     G1 m/z  329                 Welfare notified a test method for aflatoxins in 1971.
          Microorganism Species
                     as patulin and aflatoxin produced as secondary metabolites of mould.                                                     25000                     S/N=398
                                                                                                                                                                                                    The Japanese Food Sanitation Act regulates foods
                                                                                                                                              22500
                                                                                                                                                                             B2 m/z  315
                                                                                                                                              20000                          S/N=296                in which more than 10 ppb aflatoxin is detected.
                                                                                                                                              17500                                  B1 m/z  313    The aflatoxin test method was upgraded to use
                                                                                                                                                                                     S/N=203
                        Features of the LCMS-2020 Ultra Fast Liquid Chromatograph Mass Spectrometer                                           15000                                                 non-toxic reagents on 26 March 2002 and new LC
                                                                                                                                              12500
                                                                                                                                                                                                    fluorescence detection and LC/MS methods were
                                                                                                                                              10000
                         Prominence UFLC offers both speed and separation capacity as well as high accuracy and expandability not
                                                                                                                                               7500                                                 adopted.
                         available from conventional HPLC. Used with a high-speed, high-accuracy autosampler, it achieves genuine high         5000
                         throughput.                                                                                                                                                                                                                   Microorganism Species  Identification of
                                                                                                                                                      2.5  5.0  7.5  10.0  12.5  15.0  17.5  20.0 min
                         Rapid 15 msec positive/negative ion switching time permits high-speed detection (MS measurements) that follows
                         high-speed LC separation.
                                                                                                                                               Fig. 1 SIM Chromatogram of Aflatoxin Mixture (2.5 ppb each)
            Identification of
                         The newly developed Qarray ion optical system achieves superior sensitivity, reproducibility, and linearity.
                         Rapid, 15,000 u/sec scanning achieves high ion permeability while maintaining resolution.
          Microorganism Species
                                                                                                                                                                                                    Analytical Conditions
                         The LCMS-2020 dramatically enhances long-term stability and ease of maintenance.                                                                                           Column     : Imtakt Cadenza CD-C18
                                                                                                                                               Int.
                         LCMSsolution maximizes analysis performance with a number of comprehensive functions including data                      313.00 (1.41)    G2 m/z  331                                   (150 mm L. × 2.0 mm I.D.)
                                                                                                                                              9500  315.10 (1.21)  S/N=84  G1 m/z  329              Mobile phase  : acetonitrile / methanol / 10 mM ammonium acetate
                         comparisons, peak integration, and report output.                                                                    9000  329.10 (1.08)                                                = 2 / 6 / 15
                                                                                                                                                  331.10 (1.00)         S/N=60                      Flow rate  : 0.2 mL/min
                                                                                                                                              8500                           B2 m/z  315  B1 m/z  313  Column temp.  : 40 °C
                                                                                                                                              8000                           S/N=62  S/N=43         Injection volume  : 6 µL
                                                                                                                                              7500                                                  Probe voltage  : 4.5 kV (ESI-positive mode)
                                                                                                                                              7000                                                  CDL temp.  : 300 °C
                                                                                                                                                                                                    Nebulizing gas flow : 1.5 L/min
                                                                                                                                              6500
                                                                                                                                                                                                    Drying gas pressure : 0.15 MPa                     Specific Microorganisms  Detection of
                                                                                                                                              6000
                                                                                                                                                                                                    CDL voltage  : 25 V
                                                                                                                                              5500                                                  Qarray DC voltage  : Scan mode
                                                                                                                                              5000                                                  Qarray RF voltage  : Scan mode
                                                                                                                                              4500                                                  Scan range  : m/z 200-400 (1.0 sec/scan)
            Detection of
                                                                                                                                              4000                                                  SIM        : m/z 331.1, 329.1, 315.1, 313.0 (0.25 sec/ch)
                                                                                                                                              3500
                                                                                                                                              3000
          Specific Microorganisms
                                                                                                                                                     2.5  5.0  7.5  10.0  12.5  15.0  17.5  20.0 min
                                                                                                                                               Fig. 2 SIM Chromatogram of Aflatoxin Mixture (0.5 ppb each)
                                                                                                                                           Fig. 1 shows the SIM chromatogram of
                                                      LCMS-2020                                                                            four aflatoxin components, G2, G1, B2,                                                                      Components  Analysis of Microorganism-Derived
                                                      Ultra Fast Liquid Chromatograph Mass Spectrometer                                                                             Int.                                Area
                                                                                                                                           B1 (each 2.5 ppb), and Fig. 2 shows the    Aflatoxin G2    331.1            17.5e6
          Components
                                                                                                                                           SIM chromatogram of 0.5 ppb            1250e3  MW 330                       15.0e6
                                                                                                                                                                                  1000e3                               12.5e6
                                                                                                                                           concentrations. A satisfactory S/N ratio
                                                                                                                                                                                  750e3                                10.0e6
                                                                                                                                           was obtained, even at 0.5 ppb                                               7500e3
                                                                                                                                                                                  500e3
                                                                                                                                           concentration of each component.                                369.0       5000e3
            Analysis of Microorganism-Derived
                                                                                                                                                                                  250e3                  353.1  389.1  2500e3
                                                                                                                                           The LC/MS test method for aflatoxins                     313.3  362.1                r 2 =0.99998
                                                                                                                                                                                   0e3                                  0e3
                                                                                                                                           conforming to the official analytical     200    250   300    350   m/z        0  25  50  75  Conc
                                                                                                                                           method is introduced here.              Int.                                 Area
                                                                                                                                                                                      Aflatoxin G1    329.1            17.5e6
                                                                                                                                           Fig. 3 shows the MS spectra and            MW 328
                                                                                                                                                                                  750e3                                15.0e6
                                                                                                                                           calibration curves for aflatoxin G2 (600                                    12.5e6
                                                                                                                                           pg) and aflatoxin G1 (600 pg). The     500e3                                10.0e6                          Other Applications
                                                                                                                                                                                                                       7500e3
                                                                                                                                           calibration curves achieve good linearity
                                                                                                                                                                                  250e3                                5000e3
                                                                                                                                           with r 2  (coefficient of determination) =                       374.1      2500e3
                                                                                                                                                                                                   311.0                        r 2 =0.99999
                                                                                                                                           0.9999 min.                             0e3                                  0e3
                                                                                                                                                                                     200   250    300    350    m/z       0   25  50  75  Conc
          Other Applications
                                      Browser screen                          Analytical conditions optimization screens
                                                                 LCMSsolution Ver.5                                                                                                   Fig. 3 MS Spectra and Calibration Curves for Aflatoxin G2 and G1
                                                                 LCMS-2020 Workstation
          26                                                                                                                                                                                                                                            27
   22   23   24   25   26   27   28   29   30   31   32