Page 28 - Microorganism Species Analysis
P. 28

LCMS-2020                                                                                                                                                                                                           LCMS-2020
                                             Analysis of Nucleic Acids, Amino Acids, and Aflatoxins
            Microorganism Solutions                                                                                                                                                                                              Microorganism Solutions


                      Data                                                                                                                Data


                        Analysis of Amino Acids                                                                                            Analysis of Compounds Related to Nucleic Acids
                        Amino acid is a generic term for compounds that contain an amino group and a carboxyl group. Several hundred of them                                                     Nucleic acid bases and nucleotides are generally      Microorganism Species  Observation of
                                                                                                                                              (x1,000,000)
                        exist naturally. Amino acids are the basic units comprising proteins, which are one of the major biological components.   3.75  TIC                                      separated by ion-exchange or reverse-phase mode LC
                                                                                                                                              169.00 (4.77)
                                                                                                                                            3.50  269.00 (9.52)
                                                                                                                                              137.00 (1.52)
                        They provide the materials to synthesize the neurotransmitters and low-molecular-weight bioactive compounds and even   3.25  153.00 (3.21)                               and detected by UV absorbance detection.
                                                                                                                                              152.00 (1.00)
                                                                                                                                              284.00 (6.36)
                                                                                                                                              136.00 (6.42)  guanine
            Observation of
                                                                                                                                              268.00 (4.52)
                        alone offer a variety of bioactivities. They are widely researched in the fields of pharmaceuticals and foods and many amino   3.00  112.00 (1.00)  uric acid  inosine   In the example introduced here, the mass information
                                                                                                                                              113.00 (4.56)
                                                                                                                                            2.75  127.00 (4.52)  hypoxanthine  guanosine
                                                                                                                                              245.00 (8.16)
                        acids have been used for health food supplements in recent years.                                                   2.50  252.00 (4.77)  xanthine          deoxyguanosine  is acquired and the nucleic acid-related compound
                                                                                                                                              228.00 (3.91)
          Microorganism Species
                                                                                                                                            2.25    adenine                          deoxyadenosine  analyzed at high sensitivity by LC/MS.
                                                                                      Analytical Conditions                                 2.00  cytosine   thymine
                              ( x100,000)                                             Column     : Shim-pack FC-ODS                         1.75    deoxycytidine  uracil  uridine  adenosine
                               TIC                                                                 (150 mm L. × 2.0 mm I.D.)                1.50
                            3.00  76.00 (7.04)                                                                                                                                                   Fig. 1 shows the structure and ESI mass spectrum of
                                90.00 (4.84)                                          Mobile phase  : ion pair reagent-water / acetonitrile
                               147.00 (1.33)                                                                                                1.25
                            2.75  175.00 (1.00)                                       Time program  : gradient elution                      1.00                                                 the purine base Adenine and of the nucleotide
                               156.00 (1.43)
                               134.00 (4.17)                                          Flow rate  : 0.2 mL/min
                            2.50                                                                                                            0.75
                               148.00 (2.35)                   arginine                                                                                                                          Adenosine.
                               106.00 (4.39)                                          Injection volume  : 3 µL
                            2.25  120.00 (2.20)                                                                                             0.50
                               182.00 (1.42)                                          Column temp.  : 40 °C                                                                                      Under acidic conditions in the positive ion mode, the
                               150.00 (1.29)  glycine  alanine                                                                              0.25
                            2.00  166.00 (1.00)            lysine                     Probe voltage  : +4.5 kV (ESI-positive mode)
                               118.00 (1.07)                                                                                                0.00                                                                       +
                               132.00 (1.09)           histidine                      CDL temp.  : 200 °C                                                                                        protonated molecule [M+H]  is observed as a standard
                            1.75      aspartic acid                                                                                          0.0  2.5   5.0  7.5  10.0  12.5  15.0  17.5  20.0  22.5                                                   Microorganism Species  Identification of
                               116.00 (1.70)
                               205.00 (1.00)  glutamic acid                           Block heater temp.  : 200 °C
                            1.50  241.00 (2.34)  serine  threonine  tyrosine  phenylalanine                                                                                                      peak. Fig. 2 shows the LC/MS analysis results of a
                               133.00 (12.47)             methionine                  Nebulizing gas flow : 1.5 L/min
                            1.25                            valine                    Drying gas pressure : 0.1 MPa                                                                              standard mixture of nucleic acids. SIM measurements
                                            proline               isoleucine                                                                       Fig. 2 SIM Chromatogram of Standard Mixture of
                                                                    leucine           CDL voltage  : +10 V
                            1.00        cystine                         tryptophan                                                                                                                                      +
                                                                                      Qarray DC voltage  : Scan mode                                    Nucleic Acid Bases and Nucleotides       were conducted using [M+H]  as the detected ion for
                            0.75
            Identification of
                                                                                      Qarray RF voltage  : Scan mode
                            0.50                                                      SIM        : m/z 76, 90, 147, 175, 156, 134, 148,                                                          each amino acid. Satisfactory separation of the 15
                                                                                                   106, 120, 182, 122, 150, 166, 118,
          Microorganism Species
                            0.25                                                                                                                                                                 components was achieved.
                                                                                                   132, 116, 205, 241
                              0.0  1.0  2.0  3.0  4.0  5.0  6.0  7.0  8.0  9.0  10.0  11.0  12.0  13.0
                                                                                                                                                    Analytical Conditions
                                                                                                                                                    Column   : L-column ODS (150 mm L. × 2.1 mm I.D.)  Block heater temp.  : 200 °C
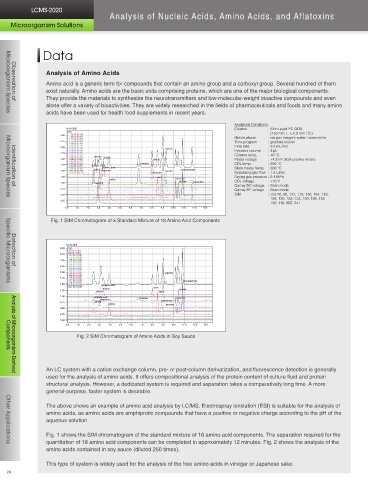
                         Fig. 1 SIM Chromatogram of a Standard Mixture of 18 Amino Acid Components                                                  Mobile phase A : 0.1% acetic acid–water  Nebulizing gas flow : 1.5 L/min
                                                                                                                                                    Mobile phase B : acetonitrile          Drying gas pressure : 0.1 MPa
                                                                                                                                                    Time program  : 1%B (0-20 min)–80%B (20.1-30 min)  CDL voltage  : +15 V
                                                                                                                                                    Flow rate  : 0.2 mL/min                Qarray DC voltage  : Scan mode
                                                                                                                                                    Injection volume : 3 µL                Qarray RF voltage  : Scan mode
                              ( x100,000)                                                                                                           Column temp.  : 30 °C                  SIM        : m/z 136, 137, 152, 153, 169, 228, 252, 268, 269, 284
                            3.00  TIC                                                                                                               Probe voltage  : +4.5 kV (ESI-positive mode)
                               76.00 (1.00)                                                                                                         CDL temp.  : 200°C                                                                                 Specific Microorganisms  Detection of
                            2.75  90.00 (1.00)
                               147.00 (1.00)
                               175.00 (1.00)
                            2.50  156.00 (1.00)
                               134.00 (1.00)
                               148.00 (1.00)
                            2.25  106.00 (1.00)
            Detection of
                               120.00 (1.00)                                                                                                          Inten.(x1,000,000)                           Inten.(x10,000,000)
                            2.00  182.00 (1.00)                arginine                                                                             10.0
                               150.00 (1.00)                                                                                                           adenine       +                          1.25  adenosine              NH 2
                               166.00 (1.00)                                                                                                                     (M+H)      NH 2                                       (M+H)   +
                            1.75  118.00 (1.00)                                                                                                               135. 9                                               267.9
                               132.00 (1.00)                         phenylalanine                                                                  7.5                                         1.00                            N
                               116.00 (1.00)                                                                                                                                   N                                           N
                            1.50  205.00 (1.00)  glutamic acid                                                                                                            N
          Specific Microorganisms
                               241.00 (1.00)               lysine                                                                                                                               0.75
                            1.25          alanine                   leucine                                                                         5.0                                                                      N  N
                                        glycine              valine
                                                                                                                                                                            N  N                0.50                       HO
                            1.00                                                                                                                                               H                                               O
                                        aspartic acid  histidine  isoleucine                                                                                                                                                  H  H
                                         threonine            methionine                                                                            2.5                    adenine   C5H5N5
                            0.75        serine                                                                                                                            Exact Mass: 135.05    0.25      136.0              H  OH  OH H
                                            proline            tyrosine                                                                                                                                                    adenosine   C10H13N5O4
                            0.50                                                                                                                             118. 9                                      119.0      289.9   Exact Mass: 267.10
                                                                                                                                                    0.0                                         0.00
                            0.25                                                                                                                            100   200    300   400   m/z                100    200   300    400   m/z
                            0.00
                              0.0  1.0  2.0  3.0  4.0  5.0  6.0  7.0  8.0  9.0  10.0  11.0  12.0  13.0                                                              Fig. 1 Positive-Ion ESI Mass Spectrum of Adenine and Adenosine
                                  Fig. 2 SIM Chromatogram of Amino Acids in Soy Sauce                                                                                                                                                                  Components  Analysis of Microorganism-Derived
                                                                                                                                           Fig. 3 shows the analysis of purine bases and
                                                                                                                                           purine nucleotides in beer.                 (x10,000)  4.0 152.00  (x10,000)  (x1,000)  7.0 152.00  7.75 153.00
                                                                                                                                                                                               (x10,000)
                                                                                                                                                                                                                                   (x1,000)
                                                                                                                                                                                                                           (x1,000)
          Components
                                                                                                                                                                                                                   136.00
                                                                                                                                                                                        136.00
                                                                                                                                                                                                       153.00
                                                                                                                                                                                      1.50    3.5     2.50        7.0
                                                                                                                                           Beer was diluted 100 times in ultrapure water   1.25  3.0  guanine/3.312  2.25 2.00  xanthine/5.133  6.5  6.5 6.0  7.50 7.25
                                                                                                                                           and filtered to create the analysis samples.   1.00  adenine/2.963  2.5 2.0  1.75 1.50  6.0  5.5  7.00
                        An LC system with a cation exchange column, pre- or post-column derivatization, and fluorescence detection is generally                                       0.75    1.5     1.25        5.5     5.0     6.75
                                                                                                                                           Xanthine and Guanosine were detected in the        1.0     1.00        5.0
                        used for the analysis of amino acids. It offers compositional analysis of the protein content of culture fluid and protein                                    0.50    0.5     0.75        4.5     4.5     6.50
            Analysis of Microorganism-Derived
                                                                                                                                           beer (Fig. 3A), whereas they were virtually    2.5  4.9  2.5  5.0  3.2  5.0  7.2  0.9  2.5  4.9  2.5  5.0  3.2  5.0  7.2
                        structural analysis. However, a dedicated system is required and separation takes a comparatively long time. A more                                            (x10,000)  10.0 268.00  (x100,000)  (x10,000)  3.2  (x1,000)  3.10 284.00
                                                                                                                                                                                                                                   (x1,000)
                                                                                                                                                                                               (x10,000)
                                                                                                                                           undetectable in the purine-cut, low-malt beer   4.00       1.50        3.3
                                                                                                                                                                                        137.00
                                                                                                                                                                                                       284.00
                                                                                                                                                                                                                   137.00
                                                                                                                                                                                                                           268.00
                        general-purpose, faster system is desirable.                                                                                                                  3.75    7.5     1.25        3.2     3.1     3.05 3.00
                                                                                                                                           (Fig. 3B).                                 3.50  hypoxanthine/4.417  1.00  guanosine/12.754  3.1  3.0  2.95
                                                                                                                                                                                      3.25    5.0     0.75        3.0 2.9  2.9    2.90 2.85
                                                                                                                                                                                      3.00        adenosine/15.848  0.50  2.8  2.8
                        The above shows an example of amino acid analysis by LC/MS. Electrospray ionization (ESI) is suitable for the analysis of                                     2.75    2.5     0.25        2.7     2.7     2.80 2.75
                        amino acids, as amino acids are amphiprotic compounds that have a positive or negative charge according to the pH of the                                      2.50  2.5  5.0  0.0  15.0  17.5  0.00 11.0  12.5  15.0  2.6  2.5  5.0  2.6  15.0  17.5  2.70 11.0  12.5  15.0
                                                                                                                                                                                       (x1,000)  (x10,000)  (x10,000)  4.75  (x1,000)  (x1,000)  3.50  (x1,000)
                        aqueous solution.                                                                                                                                             11.0 10.0  269.00  4.0  252.00  10.0 268.00  4.50  269.00  7.25  252.00  268.00  Other Applications
                                                                                                                                                                                      9.0  inosine/11.929  3.5  7.5  4.25  7.00   3.25
                                                                                                                                                                                      8.0     3.0  deoxyadenosine/18.183  deoxyguanosine/16.950  4.00  deoxyguanosine/17.683
                                                                                                                                                                                      7.0     2.5     5.0                 6.75    3.00
                        Fig. 1 shows the SIM chromatogram of the standard mixture of 18 amino acid components. The separation required for the                                        6.0     2.0                 3.75    6.50
                                                                                                                                                                                      5.0     1.5     2.5         3.50            2.75
                        quantitation of 18 amino acid components can be completed in approximately 12 minutes. Fig. 2 shows the analysis of the                                       4.0     1.0                 3.25    6.25
          Other Applications
                                                                                                                                                                                      3.0     0.5     0.0         3.00    6.00    2.50
                        amino acids contained in soy sauce (diluted 250 times).                                                                                                        10.0  12.5  17.5  20.0  15.5  17.5  19.5  10.0  12.5  17.5  20.0  15.5  17.5  19.5
                                                                                                                                                                                                 A: Beer                 B: Purine-cut low-malt beer
                        This type of system is widely used for the analysis of the free amino acids in vinegar or Japanese sake.                                                        Fig. 3 SIM Chromatograms of Purine Bases and Nucleotides in Beer
          28                                                                                                                                                                                                                                            29
   23   24   25   26   27   28   29   30   31   32