
Page 86 - Application Handbook - Liquid Chromatography
P. 86
Application No.L440
News
n Structure Prediction and MRM Analysis of Impurities n 2-Dimensional Separation of Impurity Peak
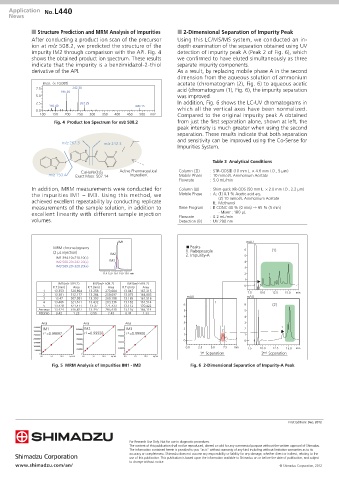
After conducting a product ion scan of the precursor Using this LC/MS/MS system, we conducted an in-
ion at m/z 508.2, we predicted the structure of the depth examination of the separation obtained using UV
impurity IM2 through comparison with the API. Fig. 4 detection of impurity peak A (Peak 2 of Fig. 6), which
shows the obtained product ion spectrum. These results we confirmed to have eluted simultaneously as three
indicate that the impurity is a benzimidazol-2-thiol separate impurity components.
derivative of the API. As a result, by replacing mobile phase A in the second
dimension from the aqueous solution of ammonium
Inten. (× 10,000) acetate (chromatogram (2), Fig. 6) to aqueous acetic
7.5 242.30 acid (chromatogram (1), Fig. 6), the impurity separation
195.30
5.0 was improved.
2.5 267.25 In addition, Fig. 6 shows the LC-UV chromatograms in
150.40 490.15
0.0 which all the vertical axes have been normalized.
100 150 200 250 300 350 400 450 500 m/z Compared to the original impurity peak A obtained
Fig. 4 Product Ion Spectrum for m/z 508.2 from just the first separation alone, shown at left, the
peak intensity is much greater when using the second
separation. These results indicate that both separation
and sensitivity can be improved using the Co-Sense for
m/z 267.3 m/z 242.3 O
Impurities System.
H
N O O
S
N
N Table 3 Analytical Conditions
S
N N
H Active Pharmaceutical Column (Ⅱ) : STR-ODSⅡ (10 mm L. × 4.6 mm I.D., 5 µm)
C25H25N5O3S2
m/z 150.4 Exact Mass: 507.14 Ingredient Mobile Phase : 10 mmol/L Ammonium Acetate
Flowrate : 5.0 mL/min
In addition, MRM measurements were conducted for Column (Ⅲ) : Shim-pack XR-ODS (50 mm L. × 2.0 mm I.D., 2.2 µm)
the impurities IM1 – IM3. Using this method, we Mobile Phase : A; (1) 0.1 % Acetic acid aq.
achieved excellent repeatability by conducting replicate (2) 10 mmol/L Ammonium Acetate
B; Methanol
measurements of the sample solution, in addition to Time Program : B CONC 40 % (0 min) → 65 % (5 min)
excellent linearity with different sample injection Flowrate · Mixer : 180 µL
: 0.2 mL/min
volumes. Detection (B) : UV 290 nm
IM1 mAU
MRM chromatograms Peaks 6 (1)
(2 µL injection) IM2 1. Rabeprazole
IM1:394.10>210.10(+) 2. Impurity-A 5
IM2:508.20>242.20(+) IM3 4
IM3:569.20>328.20(+) 3
11.0 12.0 13.0 14.0 15.0 min 2 1
1
IM1(m/z 394.2) IM2(m/z 508.2) IM3(m/z 569.2)
R.T.(min) Area R.T.(min) Area R.T.(min) Area 0
1 13.353 520,894 13.258 273,084 13.047 167,315 7.5 10.0 12.5 15.0 min
2 13.381 512,177 13.284 259,097 13.075 164,805 mAU mAU
3 13.47 507,981 13.393 260,198 13.165 161,516
4 13.486 521,671 13.432 263,336 13.182 161,514 1
5 13.428 521,411 13.37 271,433 13.112 170,422 6 6 (2)
Average 13.424 516,827 13.347 265,430 13.116 165,114 5 5
RSD(%) 0.42 1.23 0.55 2.43 0.44 2.33
4 4
Area Area Area 3 3
3500000 IM1 IM2 IM3 2 2 1
3000000 r 2 =0.99897 1250000 r 2 =0.99928 1000000 r 2 =0.99900 2
2500000 1000000 1 1
750000
2000000 750000 0 0
1500000 500000
500000
1000000 0.0 2.5 5.0 7.5 min
250000 250000 7.5 10.0 12.5 15.0 min
500000
0 0 0 1 st Separation 2 nd Separation
0.0 5.0 10.0 Inj. Vol. 0.0 5.0 10.0 Inj. Vol. 0.0 5.0 10.0 Inj. Vol.
Fig. 5 MRM Analysis of Impurities IM1 - IM3 Fig. 6 2-Dimensional Separation of Impurity-A Peak
First Edition: Dec, 2012
For Research Use Only. Not for use in diagnostic procedures.
The content of this publication shall not be reproduced, altered or sold for any commercial purpose without the written approval of Shimadzu.
The information contained herein is provided to you "as is" without warranty of any kind including without limitation warranties as to its
accuracy or completeness. Shimadzu does not assume any responsibility or liability for any damage, whether direct or indirect, relating to the
use of this publication. This publication is based upon the information available to Shimadzu on or before the date of publication, and subject
to change without notice.
www.shimadzu.com/an/ © Shimadzu Corporation, 2012