
Page 75 - Application Handbook - Liquid Chromatography
P. 75
Application No.L484
News
n Calibration Curve Linearity
8IFBU
Fig. 3 shows the calibration curves generated from
analyses using the conditions of Table 1. Excellent (SJOE MFTT UIBO N
linearity with a coefficient of determination greater
2
than R =0.9999 was obtained for both substances over H
a concentration range of 0.1 to 4 ppm. N- XBUFS BDFUPOJUSJMF W W
4IBLF GPS NJO
"SFB
7BDVVNFE pMUSBUJPO CZ 8IBUNBO (' #
7BDVVNFE pMUSBUJPO CZ 8IBUNBO (' #
7BDVVNFE pMUSBUJPO CZ 8IBUNBO (' #
B /JWBMFOPM
3 N-
N-
$MFBO VQ CZ NVMUJ GVODUJPOBM DPMVNO
$MFBO VQ CZ NVMUJ GVODUJPOBM DPMVNO
l.VMUJ4FQ z PS l"VUPQSFQ .' 5z
l.VMUJ4FQ z PS l"VUPQSFQ .' 5z
N-
N-
&WBQPSBUJPO CZ / HBT VOEFS ˆ
N- XBUFS BDFUPOJUSJMF NFUIBOPM
'JMUSBUJPO W W W
$POD QQN
"SFB
4BNQMF TPMVUJPO
C %FPYZOJWBMFOPM
3
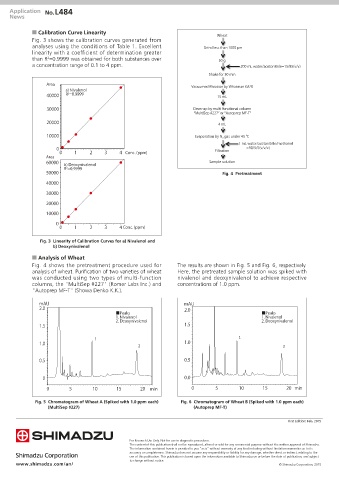
Fig. 4 Pretreatment
$POD QQN
Fig. 3 Linearity of Calibration Curves for a) Nivalenol and
b) Deoxynivalenol
n Analysis of Wheat
Fig. 4 shows the pretreatment procedure used for The results are shown in Fig. 5 and Fig. 6, respectively.
analysis of wheat. Purification of two varieties of wheat Here, the pretreated sample solution was spiked with
was conducted using two types of multi-function nivalenol and deoxynivalenol to achieve respective
columns, the "MultiSep #227" (Romer Labs Inc.) and concentrations of 1.0 ppm.
"Autoprep MF-T" (Showa Denko K.K.).
N"6 N"6
˙1FBLT ˙1FBLT
/JWBMFOPM /JWBMFOPM
%FPYZOJWBMFOPM %FPYZOJWBMFOPM
NJO NJO
Fig. 5 Chromatogram of Wheat A (Spiked with 1.0 ppm each) Fig. 6 Chromatogram of Wheat B (Spiked with 1.0 ppm each)
(MultiSep #227) (Autoprep MF-T)
First Edition: Feb. 2015
For Research Use Only. Not for use in diagnostic procedures.
The content of this publication shall not be reproduced, altered or sold for any commercial purpose without the written approval of Shimadzu.
The information contained herein is provided to you "as is" without warranty of any kind including without limitation warranties as to its
accuracy or completeness. Shimadzu does not assume any responsibility or liability for any damage, whether direct or indirect, relating to the
use of this publication. This publication is based upon the information available to Shimadzu on or before the date of publication, and subject
to change without notice.
www.shimadzu.com/an/ © Shimadzu Corporation, 2015