
Page 53 - Application Handbook - Liquid Chromatography
P. 53
Application No.L421
News
n Analysis of Artificial Colorings in Food
Pickle juice and liquid extract of candy were measured retention times and spectral patterns of the detected
using the analytical conditions shown in Table 1. The peaks matched those of the standard substances.
mAU mAU
40 40
mAU 30 mAU ■Peaks 30 mAU ■Peak
1.0 Peak 4 Peak 10 4. R102 Peak 3
30 20 10. R106 30 20 3. B2
0.5 10 3
10 10
20 0.0 20
0 0
300 500 nm 300 500 nm 300 500 nm
10 10
4
0 0
0.00 0.25 0.50 0.75 1.00 min 0.00 0.25 0.50 0.75 1.00min
Fig. 2 Chromatograms and Spectra of Artificial Colorings in Food (Left: Pickle, Right: Candy)
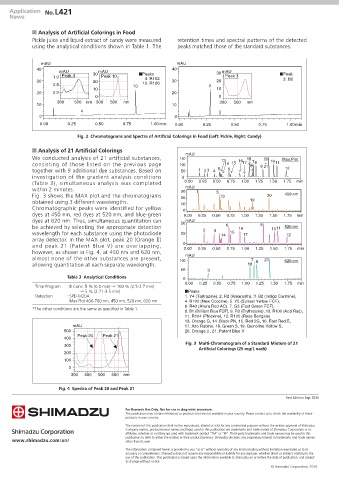
n Analysis of 21 Artificial Colorings
mAU
We conducted analysis of 21 artificial substances, 150 13 16 18 20 Max.Plot
consisting of those listed on the previous page 100 14 15 17 19 7 8 9 21 10 11
+
together with 9 additional dye substances. Based on 50 1 2 3 4 5 6 12
investigation of the gradient analysis conditions 0
(Table 3), simultaneous analysis was completed 0.00 0.25 0.50 0.75 1.00 1.25 1.50 1.75 min
within 2 minutes. 30 mAU 1
Fig. 3 shows the MAX plot and the chromatograms 20 5 13 20 450 nm
obtained using 3 different wavelengths. 10 19
Chromatographic peaks were identified for yellow 0
dyes at 450 nm, red dyes at 520 nm, and blue-green 0.00 0.25 0.50 0.75 1.00 1.25 1.50 1.75 min
dyes at 620 nm. Thus, simultaneous quantitation can 50 mAU
be achieved by selecting the appropriate detection 6 16 9 10 11 520 nm
wavelength for each substance using the photodiode 25 2 4 14 15 17 12
array detector. In the MAX plot, peak 20 (Orange Ⅱ)
and peak 21 (Patent Blue V) are overlapping, 0 0.00 0.25 0.50 0.75 1.00 1.25 1.50 1.75 min
however, as shown in Fig. 4, at 450 nm and 620 nm,
almost none of the other substances are present, 100 mAU 7 21 620 nm
allowing quantitation at each separate wavelength. 18 8
50 3
Table 3 Analytical Conditions
0
0.00 0.25 0.50 0.75 1.00 1.25 1.50 1.75 min
Time Program : B Conc. 5 % (0.0 min) → 100 % (2.5-2.7 min)
→ 5 % (2.71-3.5 min) ■Peaks
Detection : SPD-M20A 1. Y4 (Tartrazine), 2. R2 (Amaranth), 3. B2 (Indigo Carmine),
Max Plot 400-700 nm, 450 nm, 520 nm, 620 nm 4. R102 (New Coccine), 5. Y5 (Sunset Yellow FCF),
6. R40 (Allura Red AC), 7. G3 (Fast Green FCF),
*The other conditions are the same as specified in Table 1.
8. B1 (Brilliant Blue FCF), 9. R3 (Erythrosine), 10. R106 (Acid Red),
11. R104 (Phloxine), 12. R105 (Rose Bengale)
13. Orange G, 14. Black PN, 15. Red 2G, 16. Fast Red E,
mAU 17. AzoRubine, 18. Green S, 19. QuinolineYellow S,
500 20. Orangeᶘ, 21. Patent Blue V
Peak 20 Peak 21
400
Fig. 3 Multi-Chromatogram of a Standard Mixture of 21
300
Artificial Colorings (25 mg/L each)
200
100
0
300 400 500 600 nm
Fig. 4 Spectra of Peak 20 and Peak 21
First Edition: Sep. 2011
For Research Use Only. Not for use in diagnostic procedure.
This publication may contain references to products that are not available in your country. Please contact us to check the availability of these
products in your country.
The content of this publication shall not be reproduced, altered or sold for any commercial purpose without the written approval of Shimadzu.
Company names, product/service names and logos used in this publication are trademarks and trade names of Shimadzu Corporation or its
affiliates, whether or not they are used with trademark symbol “TM” or “®”. Third-party trademarks and trade names may be used in this
publication to refer to either the entities or their products/services. Shimadzu disclaims any proprietary interest in trademarks and trade names
www.shimadzu.com/an/ other than its own.
The information contained herein is provided to you "as is" without warranty of any kind including without limitation warranties as to its
accuracy or completeness. Shimadzu does not assume any responsibility or liability for any damage, whether direct or indirect, relating to the
use of this publication. This publication is based upon the information available to Shimadzu on or before the date of publication, and subject
to change without notice.
© Shimadzu Corporation, 2016