
Page 16 - 1_Environmental analysis
P. 16
SCA-130-107
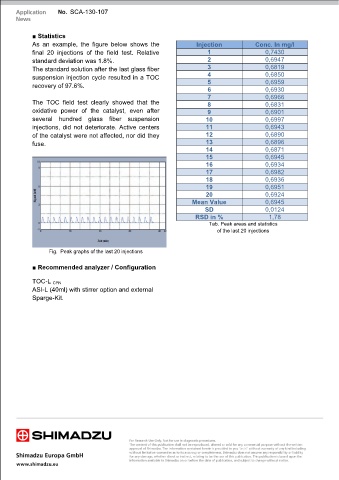
■ Statistics
As an example, the figure below shows the Injection Conc. In mg/l
final 20 injections of the field test. Relative 1 0,7430
standard deviation was 1.8%. 2 0,6947
The standard solution after the last glass fiber 3 0,6819
suspension injection cycle resulted in a TOC 4 0,6850
recovery of 97.6%. 5 0,6959
0,6930
6
7 0,6966
The TOC field test clearly showed that the 8 0,6831
oxidative power of the catalyst, even after 9 0,6901
several hundred glass fiber suspension 10 0,6997
injections, did not deteriorate. Active centers 11 0,6943
of the catalyst were not affected, nor did they 12 0,6890
fuse. 13 0,6896
14 0,6871
15 0,6945
16 0,6934
17 0,6982
18 0,6936
19 0,6951
20 0,6924
Mean Value 0,6945
SD 0,0124
RSD in % 1,78
Tab. Peak areas and statistics
of the last 20 injections
Fig. Peak graphs of the last 20 injections
■ Recommended analyzer / Configuration
TOC-L CPN
ASI-L (40ml) with stirrer option and external
Sparge-Kit.
Shimadzu Deutschland GmbH
Info@shimadzu.de
www.shimadzu.de/home