Page 16 - Food&Beverages Solutions-for-EtO-Analysis-SSI
P. 16

1.3  Sesame Seeds Analysis - Conversion Method


                                                                                              Application Databook


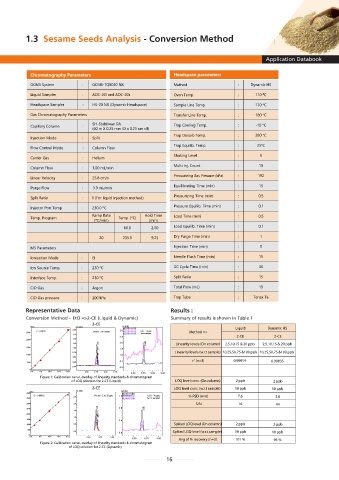
          Representative Data                                Results :
          Conversion Method – EtO =>2-CE (Liquid & Dynamic)  Summary of results is shown in Table 1
                                 2-CE
            Area            (x1,000)        (x100)                                  Liquid     Dynamic HS
                           2.00             80.00>31.00
              r 2 = 0.99919                3.0 80.00>44.00  LOQ  – 10 ppb   Method =>
          2500                    Overlay – 2 to  20 ppb
                           1.75             82.00>31.00  (w.r.t sample)
                                           2.5                                      2-CE         2-CE
                           1.50
          2000
                           1.25     2-CE  2-CE  2.0  2-CE      Linearity levels (On column)  2,5,10,15 & 20 ppb  2,5,10,15 & 20 ppb
          1500             1.00     2- C E  1.5
                           0.75                               Linearity levels (w.r.t sample) 10,25,50,75 &100 ppb 10,25,50,75 &100 ppb
          1000                      2 -CE  1.0
                                   2-CE                              2
                           0.50
           500             0.25     2-CE   0.5                       r (n=3)       0.99919      0.99835
                           0.00            0.0
           0
            0.0  5.0  10.0  15.0  Conc.  8.50  8.75  9.00  9.25
                                               8.50  8.75  9.00  9.25
               Figure 1: Calibration curve, overlay of linearity standards & chromatogram
                          of LOQ solution for 2-CE (Liquid)    LOQ level conc. (On column)  2 ppb  2 ppb
                                 2-CE                         LOQ level conc. (w.r.t sample)  10 ppb  10 ppb
                            (x1,000)
           Area                             (x100)
          4000                              80.00>31.00
             r2 = 0.99835         Ovelay - 2 to 20 ppb   7.5 80.00>44.00  LOQ - 10 ppb   % RSD (n=6)  7.6  3.8
          3500             2.5              82.00>31.00  (w.r.t sample)
          3000             2.0                                        S/N            16           44
          2500                     2-CE  2-CE  5.0  2 -CE
                           1.5
                                   2-CE
          2000                     2-CE  2 -CE 2-CE
                           1.0
          1500                     2-CE 2 -CE  2 -CE  2.5
          1000             0.5     2-CE                       Spiked LOQ level (On column)  2 ppb  2 ppb
           500
                           0.0                                Spiked LOQ level (w.r.t sample)  10 ppb  10 ppb
                                           0.0
           0
           0.0  5.0  10.0  15.0  Conc.  8.50  8.75  9.00
                                               8.50  8.75  9.00  Avg of % recovery (n=3)  101 %  95 %
                Figure 2: Calibration curve, overlay of linearity standards & chromatogram
                         of LOQ solution for 2-CE (Dynamic)
                                                           16
   11   12   13   14   15   16   17   18   19   20   21