
Page 5 - LifeScience Solution for FNIRS
P. 5
For Research Use Only. Not for use in diagnostic procedures.
Principle of Using Near Infrared Light to
Measure Brain Function Light to Measure Brain Function Principle of Using Near Infrared
Near infrared light refers to wavelengths longer than visible Biological Window: Wavelength Range that Infrared light is transmitted to the head surface by optical fibers distributed at fixed intervals. Normally, in the case of adults, a
light, in the wavelength range from 700 nm to 1400 nm, Penetrates the Body Relatively Easily lattice of optical fiber probes for emitting and receiving are spaced 30 mm apart (Fig. 4). The light irradiated on the head
where many compounds in living organisms exhibit high 120 surface passes through the scalp and skull before reaching the cerebral cortex, the surface of the brain, where it is absorbed or Imaging Optical Brain-Function
absorption intensity. These longer wavelengths exhibit a high 100 scattered. After traveling via a complicated path, only a small portion of the attenuated light reaches the optical fibers for
absorption by water. receiving the light. This slight amount of light is amplified by a photomultiplier tube and detected with high sensitivity over a
In contrast, shorter wavelengths, in the visible range (400 to 80 broad dynamic range, thereby accurately capturing the slight changes in Hb concentration in the brain due to brain activity.
700 nm), are absorbed more readily by many constituent
components of biological organisms. Consequently, these 60 Terminal Colors: Send/Receive Since the exact path traversed by the light through the body (optical path length) bilitation Neuroreha-
wavelength ranges cannot be used to penetrate biological Hemoglobin cannot be determined, it is not possible to calculate the Hb concentration as an
organisms. Since the infrared wavelength range is able to 40 Water absolute value. Therefore, the change in Hb (change in Hb concentration multiplied
penetrate biological organisms relatively well, it is sometimes 20 by the path length) is determined instead.
referred to as a biological window (Fig. 1). Fig. 4 shows an example of using a 4 × 4 matrix of fibers, consisting of 8 pairs of
transmitter and receiver fibers. Each pair of transmitter and receiver fibers is
0 referred to as a channel; in this case, there are 24 channel measurement points. fNIRS and fMRI Comparison of
200 600 1000 1400 1800 2200 2600 3000
Hemoglobin (Hb), a protein that functions as a carrier of Wavelength (nm)
oxygen in the blood, is a biological substance known to Fig. 1 Absorbance of Water and Hemoglobin
exhibit high absorption of near infrared wavelengths in the in the Infrared Wavelength Range
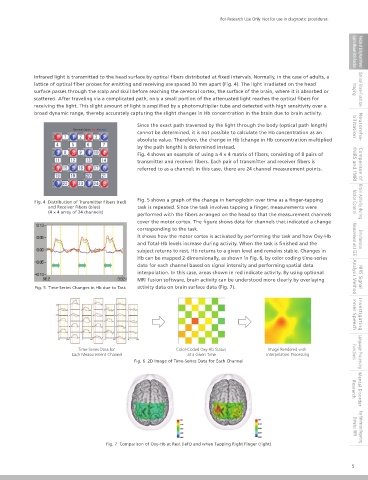
700 to 900 nm range. The hemoglobin molecule has the Fig. 5 shows a graph of the change in hemoglobin over time as a finger-tapping
characteristic of exhibiting a different absorption spectrum 3 Fig. 4 Distribution of Transmitter Fibers (red) task is repeated. Since the task involves tapping a finger, measurements were Motor Control Brain Activity during
and Receiver Fibers (blue)
for oxygenated hemoglobin (Oxy-Hb), which has oxygen Deoxy-Hb (4 × 4 array of 24 channels) performed with the fibers arranged on the head so that the measurement channels
bonded to the molecule, and deoxygenated hemoglobin 2.5 cover the motor cortex. The figure shows data for channels that indicated a change
(Deoxy-Hb), where oxygen is separated from the molecule. 2 780 corresponding to the task.
Their absorption is equivalent (molecular absorption Oxy-Hb It shows how the motor cortex is activated by performing the task and how Oxy-Hb
coefficients are equal) near 805 nm, where the molecular 1.5 830 and Total-Hb levels increase during activity. When the task is finished and the Measurement with EEG Simultaneous
absorption coefficient for Deoxy-Hb is greater toward shorter Molecular Absorption Coefficient subject returns to rest, Hb returns to a given level and remains stable. Changes in
wavelengths and the molecular absorption coefficient for 1 Hb can be mapped 2-dimensionally, as shown in Fig. 6, by color coding time-series
Oxy-Hb is greater toward longer wavelengths (Fig. 2). Since data for each channel based on signal intensity and performing spatial data
the molecular absorption coefficients for hemoglobin at each 0.5 interpolation. In this case, areas shown in red indicate activity. By using optional
wavelength are already known, measuring the change in 805 MRI fusion software, brain activity can be understood more clearly by overlaying Analysis Method NIRS Signal
absorption at two or more wavelengths allows calculating 0 650 750 850 950 nm activity data on brain surface data (Fig. 7).
the change in Oxy-Hb and Deoxy-Hb. Shimadzu near-infrared Visible Light Near Infrared Light Fig. 5 Time-Series Changes in Hb due to Task
optical brain-function imaging systems use three wavelengths
– 780, 805, and 830 nm. 400 to 700nm 700 to 1400nm
Fig. 2 Absorption Spectrum of Hemoglobin Inner Speech Investigating
Although near infrared wavelengths penetrate organisms well, organisms also readily scatter light. Therefore, it is difficult to
detect straight transmission of light when measuring something the size and thickness of a human head. Consequently, to
measure brain function using near infrared light, reflected light by scattering is measured (Fig. 3).
Optical Fiber Brain Surface Data is Detected by Measuring Reflection Time-Series Data for Color-Coded Oxy-Hb Status Image Rendered with Functions Language Processing
Each Measurement Channel at a Given Time Interpolation Processing
Light Emitting Fig. 6 2D Image of Time-Series Data for Each Channel
Probe
Light Receiving
Probe Research Mental Disorder
Detector Path of Light Within Organism Shimadzu fNIRS Key References Regarding
Biological Organisms Cause Significant Scattering
Fig. 3 Illustration of Reflection Measurement Method from Head Surface and Light Propagation Fig. 7 Comparison of Oxy-Hb at Rest (left) and when Tapping Right Finger (right)
4 5