Page 56 - Pharmaceutical- Guide to Biopharmaceutical
P. 56

Characterization                Quality Control               Pharmacokinetics


                     Biomarker Discovery                                                                                                MALDI-8020


                                      Profiling Cancer Cells Using a                                                                                       benefits

                                   Benchtop MALDI-TOF MS System                                                                                                                                                                              Cell Line Optimization
                                                                                                 click here                                     •   Enables rapid and highly sensitive benchtop profiling.
                                                                                                                                                •   Easy maintenance and low running costs
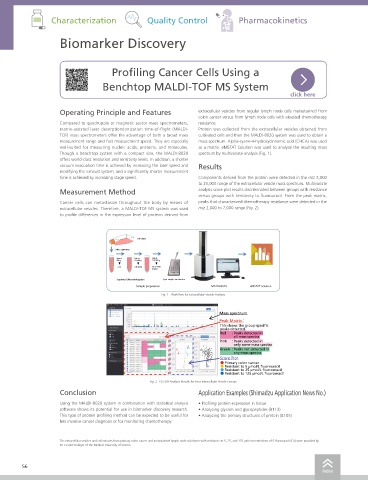
                     Operating Principle and Features              extracellular vesicles from regular lymph node cells metastasized from
                                                                   colon cancer versus from lymph node cells with elevated chemotherapy         •   Can search a wide range of molecular weights for nucleic acids, proteins, and molecules.
                     Compared to quadrupole or magnetic sector mass spectrometers,   resistance.
                     matrix-assisted laser desorption/ionization time-of-flight (MALDI-  Protein was collected from the extracellular vesicles obtained from
                     TOF) mass spectrometers offer the advantage of both a broad mass   cultivated cells and then the MALDI-8020 system was used to obtain a                                                                                 Culture
                     measurement range and fast measurement speed. They are especially   mass spectrum. Alpha-cyano-4-hydroxycinnamic acid (CHCA) was used
                     well-suited for measuring nucleic acids, proteins, and molecules.   as a matrix. eMSTAT Solution was used to analyze the resulting mass
                     Though a benchtop system with a compact size, the MALDI-8020   spectrum by multivariate analysis (Fig. 1).
                     offers world-class resolution and sensitivity levels. In addition, a shorter
                     vacuum evacuation time is achieved by increasing the laser speed and   Results
                     modifying the exhaust system, and a significantly shorter measurement
                     time is achieved by increasing stage speed.   Components derived from the protein were detected in the m/z 2,000
                                                                   to 25,000 range of the extracellular vesicle mass spectrum. Multivariate
                     Measurement Method                            analysis score plot results discriminated between groups with resistance
                                                                   versus groups with sensitivity to fluorouracil. From the peak matrix,                                                                                                     Purification
                     Cancer cells can metastasize throughout the body by means of   peaks that characterized chemotherapy resistance were detected in the
                     extracellular vesicles. Therefore, a MALDI-TOF MS system was used   m/z 2,000 to 7,000 range (Fig. 2).
                     to profile differences in the expression level of proteins derived from
                                                                                                                                        Specifications

                                                                                                                                         Instrument                   MALDI-8020
                                              Cell culture
                                                                                                                                         Mass range                   m/z 1 to 500,000
                                       Collect supernatant
                                                                                                                                         Mass resolution              >5,000 FWHM
                                        Spin at   Spin at   Spin at
                                        500 g  16,500 g  120,000 g                                                                                                                                                                           Characterization
                                                                                                                                         Sensitivity                  >250 amol
                                        cells  cell debris  Extracellular
                                                   vesicles
                                                                                                                                         Mass accuracy                <20 ppm with internal calibration, <150 ppm with external calibration
                                        Sequential Ultracentrifugation  Spot sample and matrix                                           Acceleration voltage         15 kV
                                              Sample preparation       MALDI-8020   eMSTAT Solution
                                                                                                                                         Laser                        Solid-state laser wavelength: 355 nm   Repetition frequency: 50, 100, or 200 Hz (variable)
                                                       Fig. 1   Workflow for Extracellular Vesicle Analysis
                                                                                                                                         Flight distance              850 mm
                                                                                                                                         Detector                     Electron Multiplier
                                                                          Mass spectrum                                                  Ion source cleaning          Includes automatic cleaning functionality (depending on built-in solid-state laser)
                                                                          Peak Matrix:                                                   Sample plate                 Disposable FlexiMass-DS and stainless steel FlexiMass-SR               Quality Control
                                                                          This shows the group-speci c
                                                                          peaks detected.
                                                                          Red   : Peaks detected in                                      Operating noise              <55 dB
                                                                                all mass spectra
                                                                          Pink   : Peaks detected in                                     Main unit power supply       Single-phase 100 V AC, 50/60 Hz, 1 kVA
                                                                                only some mass spectra
                                                                          Green  : Peaks not detected in                                 Dimensions                   W 600 mm × D 745 mm × H 1,055 mm (excluding protrusions)
                                                                                any mass spectra
                                                                          Score Plot                                                     Weight                       86 kg
                                                                          ● Primary colon cancer
                                                                          ● Resistant to 5  mol/L  uorouracil                            Operating environment        Temperature: 18 to 28 °C     Humidity: Max. 70 % (with no condensation)
                                                                          ● Resistant to 25  mol/L  uorouracil
                                                                          ● Resistant to 125  mol/L  uorouracil                          Data analysis software       eMSTAT Solution
                                                   Fig. 2   PLS-DA Analysis Results for Four Extracellular Vesicle Groups                Data analysis   Univariate analysis  t-Test, Mann-Whitney U-Test, ANOVA (analysis of variance)      Pharmacokinetics
                                                                                                                                         functionality
                     Conclusion                                    Application Examples (Shimadzu Application News No.)                                 Multivariate analysis  PCA (principal component analysis), PLS-DA
                                                                                                                                                        Discriminant analysis Support Vector Machine (SVM), Random Forest
                     Using the MALDI-8020 system in combination with statistical analysis   • Profiling protein expression in tissue
                     software shows its potential for use in biomarker discovery research.   • Analyzing glycans and glycopeptides (B113)               Other         Dynamic grouping
                     This type of protein profiling method can be expected to be useful for   • Analyzing the primary structures of protein (B105)  Display functionality  Multivariate analysis  Peak Matrix, Box Plot, ROC, AUC, Score/Loading Plot, Dendrogram
                     less invasive cancer diagnosis or for monitoring chemotherapy.
                                                                                                                                                        Discriminant analysis Discriminant analysis results (Group, Score) superimpose points for unknown samples on a score plot  Others
                                                                                                                                         Input/output data  Input     Peak list (ASCII, JCAMP, or mzML format)
                     The extracellular vesicles and cell extracts from primary colon cancer and metastasized lymph node subclones with resistance to 5, 25, and 125 μM concentrations of 5-fluorouracil (FU) were provided by    Output  Peak list (txt format), data analysis results (xlsm format), graph screenshot
                     Dr. Gerald Stubiger of the Medical University of Vienna.


        56                                                                                                                                                                                                                                  57
                                                                                                            index                                                                                                                  index
   51   52   53   54   55   56   57   58   59   60   61