
Page 20 - Shimadzu Journal vol.10 Issue1
P. 20
Materials Science
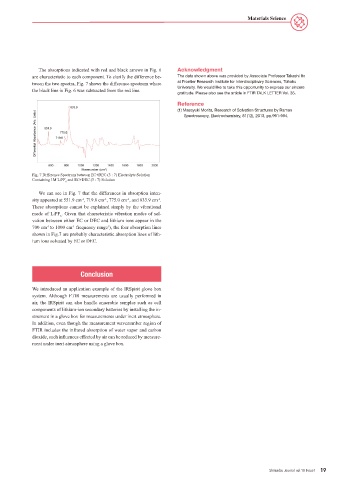
The absorptions indicated with red and black arrows in Fig. 6 Acknowledgment
are characteristic to each component. To clarify the difference be- The data shown above was provided by Associate Professor Takashi Ito
tween the two spectra, Fig. 7 shows the difference spectrum where at Frontier Research Institute for Interdisciplinary Sciences, Tohoku
the black line in Fig. 6 was subtracted from the red line. University. We would like to take this opportunity to express our sincere
gratitude. Please also see the article in FTIR TALK LETTER Vol. 35.
Reference
(1) Masayuki Morita, Research of Solvation Structures by Raman
Spectroscopy, Electrochemistry, 81(12), 2013, pp.991-994.
Fig. 7 Difference Spectrum between EC+DEC (3 : 7) Electrolyte Solution
Containing 1M LiPF and EC+DEC (3 : 7) Solution
6
We can see in Fig. 7 that the differences in absorption inten-
sity appeared at 551.9 cm , 719.8 cm , 775.0 cm , and 833.9 cm .
-1
-1
-1
-1
These absorptions cannot be explained simply by the vibrational
mode of LiPF . Given that characteristic vibration modes of sol-
6
vation between either EC or DEC and lithium ions appear in the
700 cm to 1000 cm frequency range ), the four absorption lines
1
-1
-1
shown in Fig.7 are probably characteristic absorption lines of lith-
ium ions solvated by EC or DEC.
Conclusion
We introduced an application example of the IRSpirit glove box
system. Although FTIR measurements are usually performed in
air, the IRSpirit can also handle anaerobic samples such as cell
components of lithium-ion secondary batteries by installing the in-
strument in a glove box for measurements under inert atmosphere.
In addition, even though the measurement wavenumber region of
FTIR includes the infrared absorption of water vapor and carbon
dioxide, such influences effected by air can be reduced by measure-
ment under inert atmosphere using a glove box.
Shimadzu Journal vol.10 Issue1 19