
Page 30 - Shimadzu Journal vol.7 Issue1
P. 30
Environmental Analysis
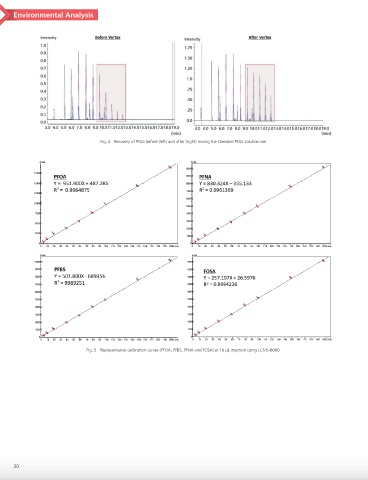
Fig. 4 Recovery of PFAS before (left) and after (right) mixing the standard PFAS solution vial
Fig. 5 Representative calibration curves (PFOA, PFBS, PFNA and FOSA) at 10 µL injection using LCMS-8060
30