
Page 8 - Shimadzu Autograph AGS-X Series
P. 8
Quest for Convenience
TRAPEZIUM X-V
Materials Testing Operation Software
Cutting-Edge Software Meets
Your Materials Development Compatible with
®
and Quality Control Needs Windows 10
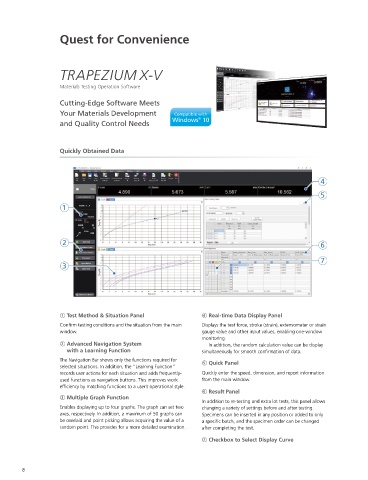
Quickly Obtained Data
4
5
1
2 6
7
3
1 Test Method & Situation Panel 4 Real-time Data Display Panel
Con rm testing conditions and the situation from the main Displays the test force, stroke (strain), extensometer or strain
window. gauge value and other input values, enabling one-window
monitoring.
2 Advanced Navigation System In addition, the random calculation value can be display
with a Learning Function simultaneously for smooth con rmation of data.
The Navigation Bar shows only the functions required for 5 Quick Panel
selected situations. In addition, the “Learning Function”
records user actions for each situation and adds frequently- Quickly enter the speed, dimension, and report information
used functions as navigation buttons. This improves work from the main window.
ef ciency by matching functions to a user’s operational style.
6 Result Panel
3 Multiple Graph Function
In addition to re-testing and extra lot tests, this panel allows
Enables displaying up to four graphs. The graph can set two changing a variety of settings before and after testing.
axes, respectively. In addition, a maximum of 50 graphs can Specimens can be inserted in any position or added to only
be overlaid and point picking allows acquiring the value of a a speci c batch, and the specimen order can be changed
random point. This provides for a more detailed examination. after completing the test.
7 Checkbox to Select Display Curve
8